


Double Top Pattern in Oil Points to $65 As Economic Weakness Outweighs OPEC+ Voluntary Cuts
Crude Oil had a second bullish attempt during summer this year as the US economy was giving some strong signals, but buyers failed to reach $100/barrel in WTI and the price has been declining pretty fast since late September. OPEC has been trying to keep the sentiment positive and extend production cuts, but nothing is stopping the decline in crude Oil, as WTI slips below $70.
OPEC+ countries decided to cut by an additional 800K bpd through voluntary reduction during Q1, under the pressure of Saudi Arabia in last week’s meeting after it was postponed from the previous week, which is a sign that member countries will likely not extend the cuts, since they are voluntary. The outcome of the meeting was uncertain and markets eventually turned bullish on Oil. But WTI failed to reach $80 following the initial jump on reports of output restrictions and subsequently reversed lower.
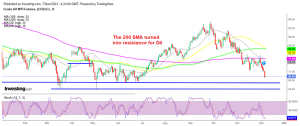
Crude Oil futures experienced the worst day since mid-November as they fell sharply by around 5%. Despite a considerable reduction in EIA Oil inventory numbers by more than 4.5K barrels which were released yesterday, concerns about the global economy are overwhelming buyers. On the daily chart, WTI crude found resistance at the 200 SMA (purple) which rejected the price for the second time, so a double top has formed, which points to $65 after the neckline at $72 was broken. However, we have the first big support near $67, where the lows from summer can be found, before heading for the double top target at $65.
EIA Weekly Crude Oil Inventories
- Reported Change for the Week: -4,632,000 barrels.
- Expected Change: -1,354,000 barrels.
- Previous Week’s Change: +1,609,000 barrels.
Breakdown by Product:
- Crude Oil: -4,632,000 barrels (compared to an expected decrease of -1,354,000 barrels).
- Gasoline: +5,421,000 barrels (compared to an expected increase of +1,027,000 barrels).
- Distillates: +1,267,000 barrels (compared to an expected increase of +1,526,000 barrels).
Other Data:
- Refinery Utilization Rate: Increased by 0.7% (compared to a previous increase of 0.8%).
- Production: Decreased by 100,000 barrels per day to 13.1 million barrels per day.
API Weekly Crude Inventories Report on Tuesday
- Crude Oil +594K
- Gasoline +2,830K
- Distillates +890K
WTI Crude Oil Live Chart


| Broker | Website | |
|---|---|---|
| 🥇 |  | Visit Broker >> |
| 🥈 | Visit Broker >> | |
| 🥉 |  | Visit Broker >> |
| 4 |  | Visit Broker >> |
| 5 |  | Visit Broker >> |
| 6 |  | Visit Broker >> |
| 7 |  | Visit Broker >> |


