Wall Street Reaches New Milestone: S&P 500 Breaches 5,000, But Questions Linger

Wall Street Reaches New Milestone: S&P 500 Breaches 5,000, But Questions Linger

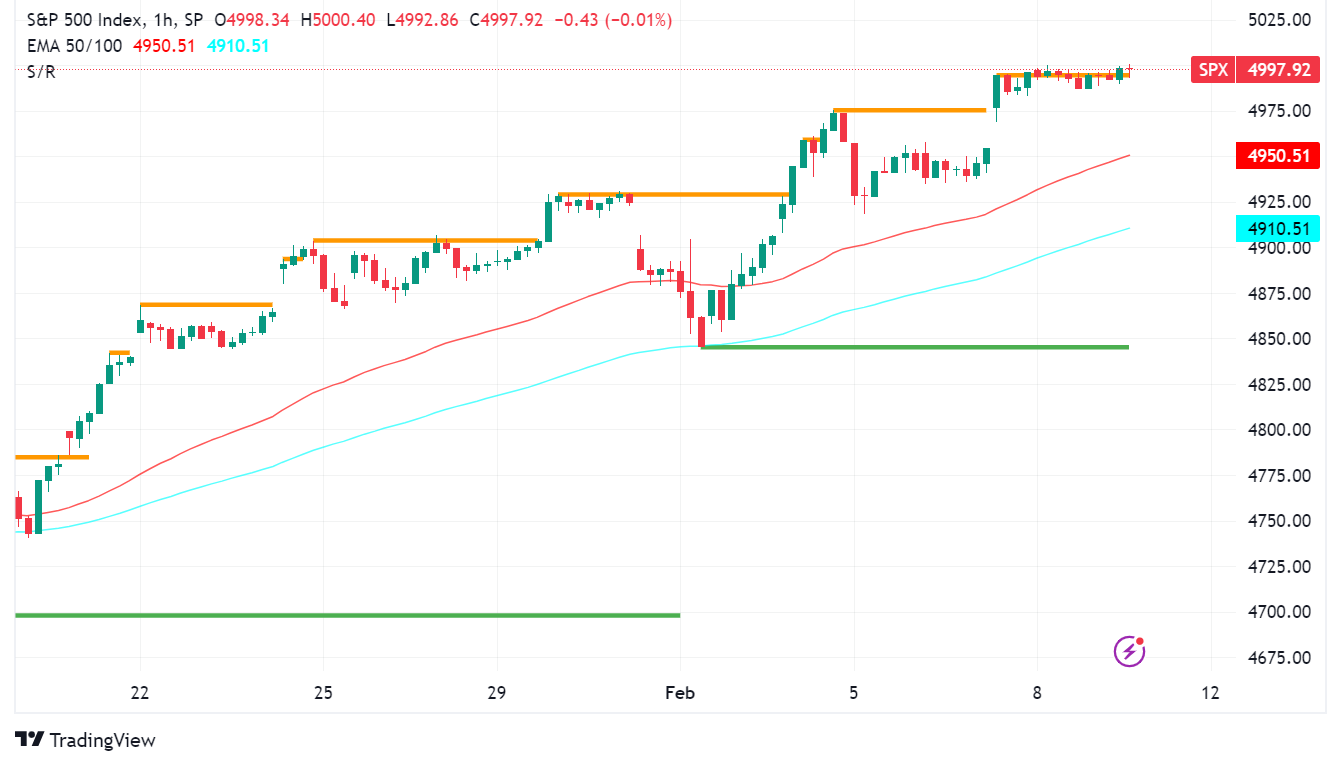
The S&P 500, a key benchmark for the US stock market, has etched its name in history by surpassing the 5,000 mark for the first time ever on February 8th, 2024. This milestone achievement sends shockwaves through the financial world, prompting questions about the reasons behind it, its impact on market valuations, and the future trajectory of the index.

Fueling the S&P 500 Rally

Several factors are attributed to the S&P 500’s ascent:

  • Strong Earnings Season: Q4 2023 witnessed robust earnings reports from many companies, exceeding analyst expectations and boosting investor confidence.
  • Positive Economic Data: Recent economic indicators point towards a resilient US economy, further fueling optimistic sentiment.
  • Federal Reserve Policy Shift: The Fed’s recent dovish stance, hinting at potential rate cuts, has eased concerns about interest rate hikes and drawn investors back to riskier assets like stocks.
  • Geopolitical Optimism: A decrease in major geopolitical tensions can contribute to improved market sentiment and risk appetite.

Impact on Valuation

Reaching 5,000 raises concerns about potential overvaluation. The Shiller P/E ratio, a popular valuation metric, currently stands at 32.1, exceeding its historical average and suggesting some stocks might be priced above their intrinsic value. However, supporters argue that strong earnings growth justifies higher valuations.

Future Outlook: What to Expect

While the future is uncertain, several factors could influence the S&P 500’s direction:

  • Earnings Outlook: Continued strong earnings growth will bolster the market, while unexpected downturns could trigger corrections.
  • Fed Policy: The Fed’s monetary policy decisions will significantly impact investor sentiment and risk appetite.
  • Geopolitical Developments: Unforeseen geopolitical events can create volatility and disrupt the market.

Technical Analysis for Traders

  • Current Price: 4,997
  • Resistance Levels: 5,100 (psychological level), 5,200 (previous resistance)
  • Support Levels: 4,900 (recent low), 4,800 (psychological level)
  • Moving Averages: 50-day MA is trending upwards, indicating potential bullish momentum.
  • RSI: Currently at 70, suggesting the S&P 500 might be nearing overbought territory.
Check out our free forex signals
Follow the top economic events on FX Leaders economic calendar
Trade better, discover more Forex Trading Strategies
ABOUT THE AUTHOR See More
Avatar
Arslan Butt
Index & Commodity Analyst
Arslan Butt serves as the Lead Commodities and Indices Analyst, bringing a wealth of expertise to the field. With an MBA in Behavioral Finance and active progress towards a Ph.D., Arslan possesses a deep understanding of market dynamics.His professional journey includes a significant role as a senior analyst at a leading brokerage firm, complementing his extensive experience as a market analyst and day trader. Adept in educating others, Arslan has a commendable track record as an instructor and public speaker.His incisive analyses, particularly within the realms of cryptocurrency and forex markets, are showcased across esteemed financial publications such as ForexCrunch, InsideBitcoins, and EconomyWatch, solidifying his reputation in the financial community.
Related Articles
Comments
0 0 votes
Article Rating
Subscribe
Notify of
guest
0 Comments
Inline Feedbacks
View all comments