Crude Oil Price Forecast: WTI Drops to $76.50 Amid Israel-Rafah Conflict
West Texas Intermediate (WTI) oil's upward trajectory paused, with prices retreating to approximately $76.50 a barrel in Monday's
Crude Oil (WTI) upward trajectory paused, with prices retreating to approximately $76.50 a barrel in Monday’s Asian trading session. The dip follows Israel’s military activities in Gaza’s Rafah, which initially stoked fears of supply disruptions but have since eased.
Middle East Tensions and Market Reactions
Despite the Israeli Prime Minister’s stance on intensifying military efforts, US President Joe Biden has urged caution to prevent further civilian harm. Concurrently, Hamas has signalled that an escalation could impede negotiations involving hostages.
Last week, oil markets reacted sharply to the geopolitical frictions, with prices climbing on the back of concerns over potential conflict escalation in the region.
Economic Headwinds and Oil Dynamics
At the Arab Fiscal Forum in Dubai, IMF’s Kristalina Georgieva remarked on the underperformance of Middle Eastern economies, attributing it partly to reduced oil output and regional conflicts. Despite these challenges, she maintained that the global economy’s fundamentals are robust.
The IMF’s recent report adjusted the Middle East and North Africa’s growth forecast to 2.9% for the year, a downgrade from earlier estimates.
Industry Data and Upcoming Reports
Baker Hughes’ latest US Oil Rig Count showed a stable count at 499 rigs, indicating steady drilling activity. Market participants are now anticipating the OPEC Monthly Oil Market Report, which promises a detailed analysis of the factors currently influencing the oil market.
This comprehensive report, expected on Tuesday, will likely shed light on the direction of the crude oil market amidst ongoing geopolitical and economic developments.
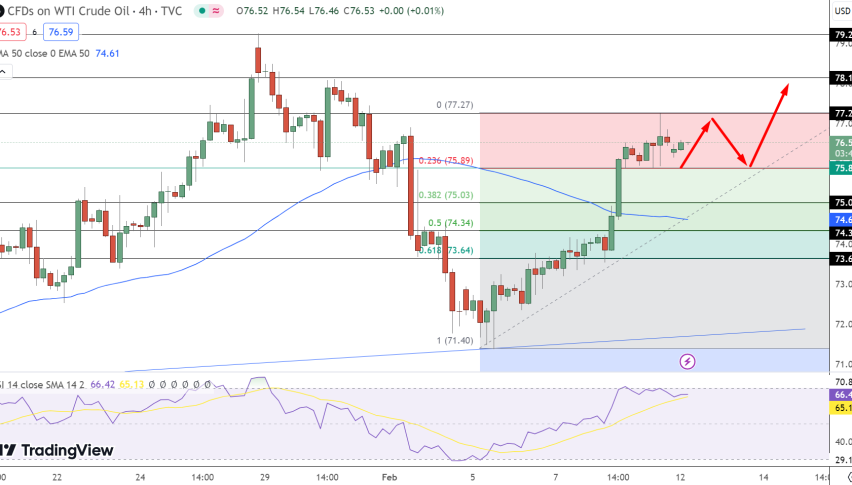
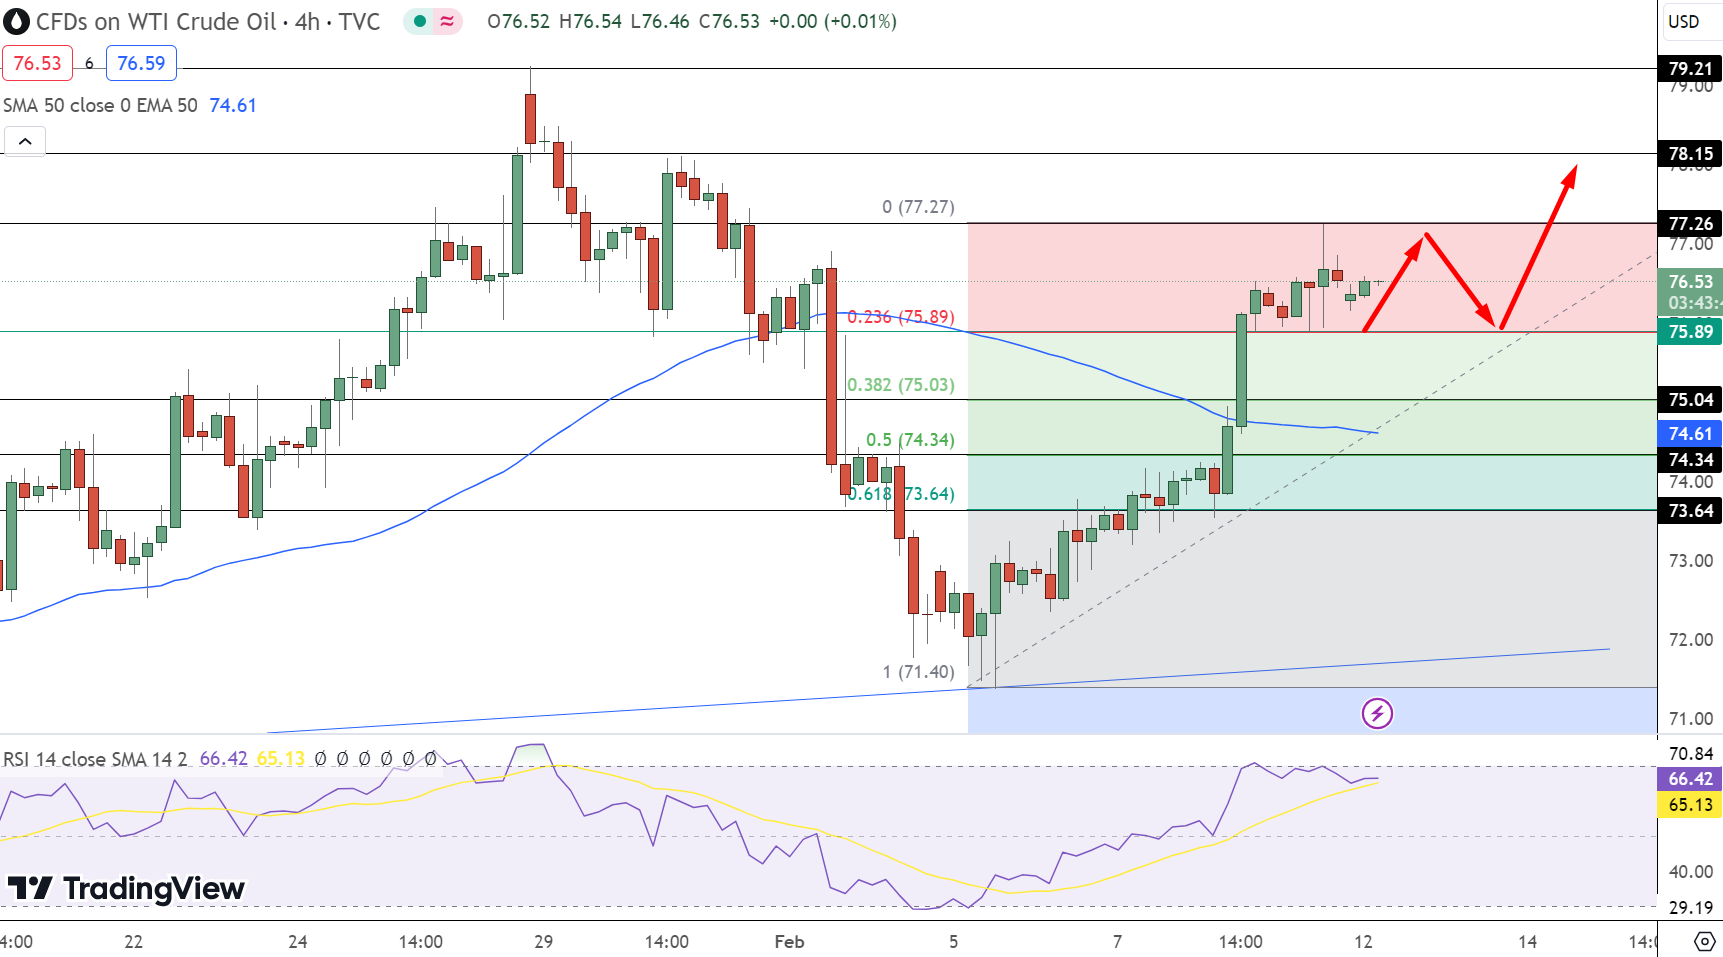
Crude Oil Price Forecast: Technical Analysis
In the latest session, WTI Crude Oil has demonstrated resilience, closing near $76.53. The market’s pivot point is at $75.04, a level that could dictate the next directional move. Resistance levels are at $75.89, $76.53, and $77.26, each presenting a ceiling that bulls might attempt to breach. Should the price retreat, support waits at $74.61, just below the pivot, with further cushions at $74.34 and $73.64, respectively.
The RSI hovers at a moderate 65.13, suggesting momentum is neither overextended nor exhausted. The 50-day EMA lies at $74.61, reinforcing the pivot level as a zone of significant technical importance.
Chart patterns indicate a consolidation phase, with the recent price action suggesting a potential breakout. If the price sustains above the pivot point and the 50-day EMA, it would signal a maintained bullish stance.
- Check out our free forex signals
- Follow the top economic events on FX Leaders economic calendar
- Trade better, discover more Forex Trading Strategies
- Open a FREE Trading Account
- Read our latest reviews on: Avatrade, Exness, HFM and XM
Related Articles


Sidebar rates
Related Posts
