Nikkei Price Forecast: NKY Above 36,850 Amid S&P Surge and Japan’s Trade Data
The S&P 500's surge to a historic close near 5,000 helped Nikkei close at 36,890. The uplift in Asian stocks is attributed to a robust.
The S&P 500’s surge to a historic close near 5,000 helped Nikkei close at 36,890. The uplift in Asian stocks is attributed to a robust U.S. economic landscape and China’s proactive measures to revitalize investor sentiment.
Japan’s economic data revealed a current account balance for December that fell short of forecasts, posting a 744.3 billion yen surplus against an anticipated 1.02 trillion yen. Due to weaker domestic demand, imports fell 5.4% in December, which offset Japan’s 9.4% year-over-year increase in exports.
China’s policymakers are gearing up to invigorate the markets before the extended Lunar New Year break as the nation grapples with deflationary forces. January saw consumer prices decline for the first time in over a decade. This has spurred authorities to intensify efforts to stimulate economic growth.
The Reserve Bank of India held its repo rate at 6.5%, marking the sixth instance without change, amidst inflation nearing the higher end of its tolerance spectrum.
Concurrently, the Bank of Thailand opted to maintain its benchmark rate despite governmental calls for cuts to rejuvenate tepid economic expansion.
Investors are poised to assess forthcoming U.S. data on jobless claims and wholesale inventories, along with Federal Reserve official Barkin’s discourse on further market direction. Chinese bourses will be closed for the Lunar New Year holiday, resuming trade the following Monday.
Nikkei 225 Price Forecast: Technical Analysis
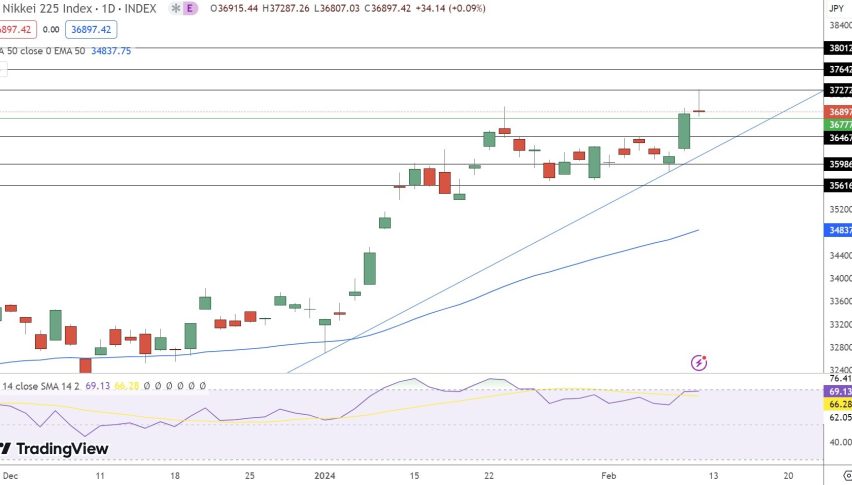
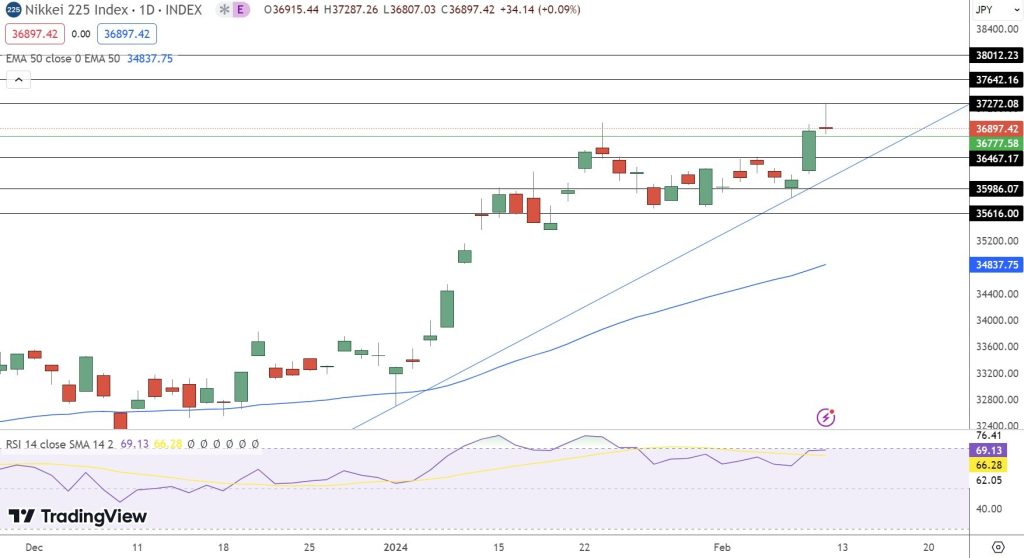
As the Nikkei 225 steadies, the index’s pivot point at ¥36,477.58 serves as the current equilibrium for traders. A slight positive bias is evident, with the index closing at ¥36,897.42, reflecting investor caution amidst a confluence of economic factors.
Resistance levels are mapped out above, with the initial at ¥36,742.16, escalating to ¥37,272.08, and stretching to a more distant ¥38,012.23, setting clear targets for bullish advances.

Conversely, support structures are noted below the pivot, beginning at ¥35,986.07 and extending to ¥35,616.00, with a crucial supportive boundary at ¥34,837.75, which could be tested should bearish pressures mount.
The Relative Strength Index (RSI) hovers at 66.28, suggesting the index is neither overbought nor oversold. The 50-day Exponential Moving Average (EMA) aligns closely with the pivot point, potentially acting as a dynamic support in the near term.
The upward trendline suggests a latent resilience near the ¥36,500 level, with the potential for a bullish engulfing candle formation to catalyze a buying trend. In conclusion, the overall trend for the Nikkei 225 remains cautiously bullish; investors may consider entries above ¥36,750 to capitalize on potential upward momentum.
- Check out our free forex signals
- Follow the top economic events on FX Leaders economic calendar
- Trade better, discover more Forex Trading Strategies
- Open a FREE Trading Account
- Read our latest reviews on: Avatrade, Exness, HFM and XM
Related Articles


Sidebar rates
Related Posts
