OPEC Cuts Agreed on Late 2023 Take Effect, Saudi Arabia Releases Data for Dec 2023
The bullish momentum gained today as OPEC realesed export data showing a sharp decline in crude exports for Q4 & Dec 2023.

Saudi Arabia released import and export data for Q4 2023 showing a sharp drop in crude oil exports. OPEC had agreed in late 2023 to reduce production to prop up crude oil prices. With several OPEC+ members announcing additional voluntary cuts.
Today’s report showed a drop of 15.8% for December 2023 over December 2022, the decrease is equal to SAR 13.5 billion ($3.65 billion). While the full Q4 2023 report showed that over the last quarter, crude oil exports fell by 17.8% compared to the last quarter of 2022.
The full quarter drop equals SAR 49.2 billion, or $13.3 billion. Considering the latest comments by Saudi Arabia and other OPEC+ members it doesn’t look like there is going to be a change of heart in production levels.
Also released earlier today by the EIA was data for crude oil stock change, which rose by 3.514 million barrels, less than expected by around 360 million barrels. The small surprise in the number was enough to drive today’s bullish afternoon session higher by 49 pips in 5 minutes.
Technical View
The daily WTI chart shows a triangle formation with the top resistance line starting at the open of the Jan 29 session. The reversal from that point stopped just below the cloud and above the SuperTrend line maintaining its bullish signal intact.
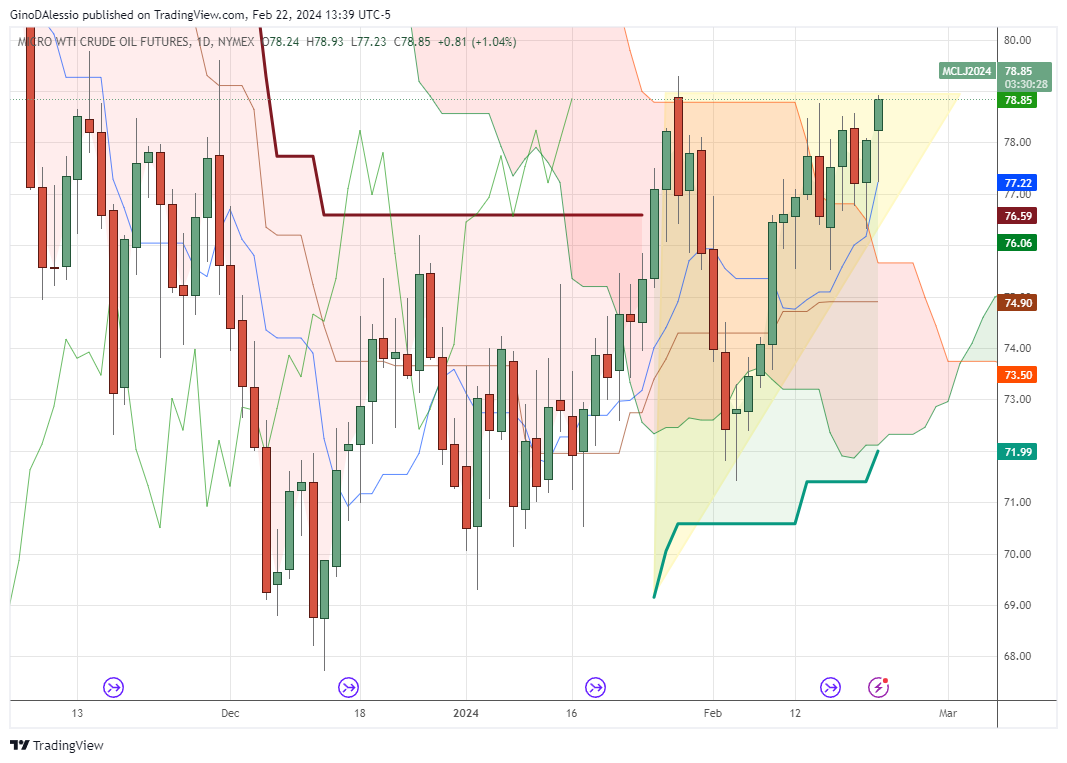
The current bull wave started after a hammer printed on Feb 5 and reversed the downward correction. Price action is now fighting with resistance from the Ichimoku Cloud (lagging line still in the cloud) and the top of the triangle, set by the open price on Jan 5.
Today’s candle hasn’t been set yet, but it would be hard to think the market would turn around enough to show anything other than what we see so far. Today’s candle once printed, should show a very bullish one-day candle.
Today’s open was $78.24, with a low 101 pips lower and a close that is set to be at or close to the Jan 5 close. However, this type of triangle needs a breakout, either above the horizontal resistance line, or below the diagonal support line to determine the next move.
But the fundamentals behind crude oil production, such as OPEC’s firm intent to maintain production cuts to protect the price and geopolitical risks make me think we’re likely to see the breakout to the upside.
- Check out our free forex signals
- Follow the top economic events on FX Leaders economic calendar
- Trade better, discover more Forex Trading Strategies
- Open a FREE Trading Account
- Read our latest reviews on: Avatrade, Exness, HFM and XM
Related Articles


Sidebar rates
Related Posts
Ava

