Forex Signals Brief Feb 23: Will the Stock Market Surge Continue Today?
Yesterday was a manufacturing and services day, with the PMI reports being released from Europe and the US. In the Eurozone, services came out of contraction, with the activity stagnating in January which is positive, however manufacturing dived further in recession, owing to a deterioration in the German manufacturing activity last month.

In the UK it was a similar situation, with services improving while manufacturing deteriorated further, falling deeper in recession. In the US it was the opposite, with manufacturing coming out of contraction, while services activity slowed somewhat, but remained in expansion. Besides that, the unemployment claims came closer to 200K.
Overall, the dollar movement was influenced by various factors, including the Fed’s stance on rate hikes, the stock market performance and economic data releases. Despite dismal economic statistics from Germany, EUR/USD remained unaffected. Meanwhile, a stronger oil inventory report and a slight increase in December retail sales supported the Canadian dollar, while the Australian dollar experienced little change after a volatile trading session.
Today’s Market Expectations
Today the economic calendar is pretty light, however we’ll see if the surge in the stock market will continue, which will also keep the risk sentiment positive in broader financial markets. The German Final GDP for Q4 is expected to remain unchanged at -0.3%, while the German Ifo Business Climate is expected to show a slight improvement from 85.2 points to 85.5.
The ECOFIN meetings from the finance ministers of the Eurozone countries will also take place today, followed by the Belgian NBB Business Climate which is expected to improve marginally. The Corporate Profits from Canada for Q4 will also be released later in the US session.
Yesterday we saw some motion with a decline in the USD in the European session and a reversal later in the US session. But the range was not too big so we only had two closed trading signals, out of 4 forex signals that we opened all day.
Gold Fails at the 50 Daily SMA Again
Following the release of the US CPI inflation statistics on Tuesday, gold saw a notable forty-dollar decline. But it has been rising for more than a week and is now trading at $2,031. Last week, buyers pushed prices back above $2,000 as they defended the 100-day Simple Moving Average (SMA) on the daily chart. Gold has demonstrated endurance in the face of market volatility, suggesting that the precious metal has a bright future. Buyers failed in their attempt to drive the price over the 50 SMA (yellow) yesterday. This shows that there is strong resistance at this moving average, where Gold failed twice in the last two days.
XAU/USD – Daily chart
EUR/USD Also Stops at the 50 SMA
This week, the EUR to USD exchange rate has been rising, and this morning, purchasers drove the price nearly to 1.09 following the release of the Eurozone services PMI, which indicated that the sector had emerged from its January contraction. The 50 SMA served as resistance near the top of the manufacturing activity decline last month, which caused the EUR/USD pair to turn lower and once again trade above 1.08.
EUR/USD – Daily Chart
Cryptocurrency Update
Bitcoin Slipps Below the 50 SMA
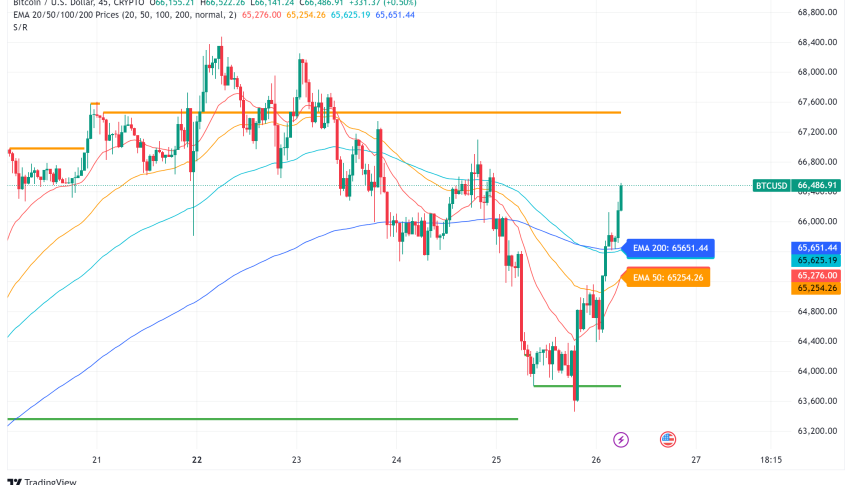
Bitcoin’s gains above $50,000 are still being consolidated. Following the SEC’s approval of an ETF, Bitcoin saw a temporary decline below $40,000 in January, but it immediately recovered and is currently back near the $50,000 mark. Notably, a rise in Bitcoin outflows is being caused by sellers selling off their holdings. But purchasers continue to hold sway, maintaining the price above the crucial $50,000 mark. With investors demonstrating a strong belief in the potential of Bitcoin going forward, this points to a highly good picture for the market.
BTC/USD – 240 minute chart
Ethereum Remains Close to the $3,000 Level
Over the last several weeks, Ethereum has seen a notable upsurge with the trade volume is rising, indicating a high level of demand. On Tuesday, buyers of ETH/USD drove the price beyond $3,000, but on Wednesday we witnessed another decline below this mark. Buyers are still in control, though, because the price remained close to this major zone. 
Ethereum – 240 minute chart
- ETH Buy Signal
- Entry Price: $2,290
- Stop Loss: $2,590
- Take Profit: $1,750
| Broker | Website | |
|---|---|---|
| 🥇 |  | Visit Broker >> |
| 🥈 |  | Visit Broker >> |
| 🥉 |  | Visit Broker >> |
| 4 |  | Visit Broker >> |
| 5 |  | Visit Broker >> |
| 6 |  | Visit Broker >> |
| 7 |  | Visit Broker >> |


