Gold Price Forecast: Eyes on $2030 as DXY Weakens, Awaiting PCE & GDP Data
Gold's price witnessed a slight uptick, reaching $2030.80 amidst a weakening US dollar. The US Dollar Index (DXY), which compares
Gold’s price witnessed a slight uptick, reaching $2030.80 amidst a weakening US dollar. The US Dollar Index (DXY), which compares the currency to a basket of six counterparts, declines by 0.05% as a result of this increase in US Treasury yields.
Currently, gold’s movement is steady at around $2030, indicating a cautious market sentiment as investors await the forthcoming Personal Consumption Expenditures (PCE) report and Gross Domestic Product (GDP) data from the Federal Reserve (Fed).
These indicators are expected to be pivotal, potentially prompting gold to break out of its recent trading range between $2,020 and $2,050.
Economic Indicators Influence Gold’s Trajectory
Recent economic data highlights significant movements that could impact gold prices. The US Department of Commerce reported a more considerable than anticipated drop in durable goods orders for January, indicating a potential tone for Q1 2024’s GDP data.
Additionally, home price data showed mixed results, reflecting an uptick in buyer demand. This backdrop sets the stage for gold as it navigates through economic uncertainties and anticipates key data releases that could dictate its short-term direction.
Anticipating Key Economic Data Releases
The market is on edge for the release of crucial economic data points that could influence the Fed’s monetary policy and, consequently, gold prices.
With investors pricing out a Fed rate cut in March and May and the odds of a 25 basis point rate cut in June standing at 49.7%, attention turns to the upcoming Prelim GDP q/q, GDP Price Index q/q, Goods Trade Balance, and Prelim Wholesale Inventories m/m.
These figures will be instrumental in shaping market expectations and gold price movements as the financial landscape contends with ongoing inflation risks and policy adjustments.
Gold Price Forecast: Technical Analysis
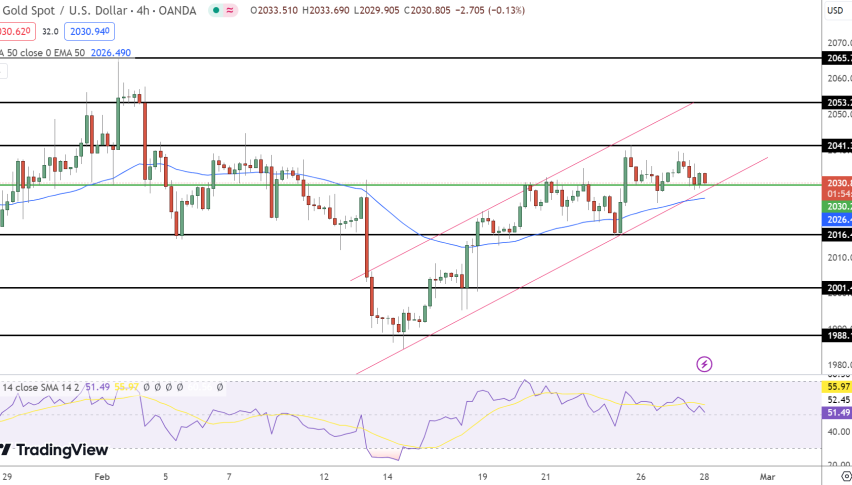
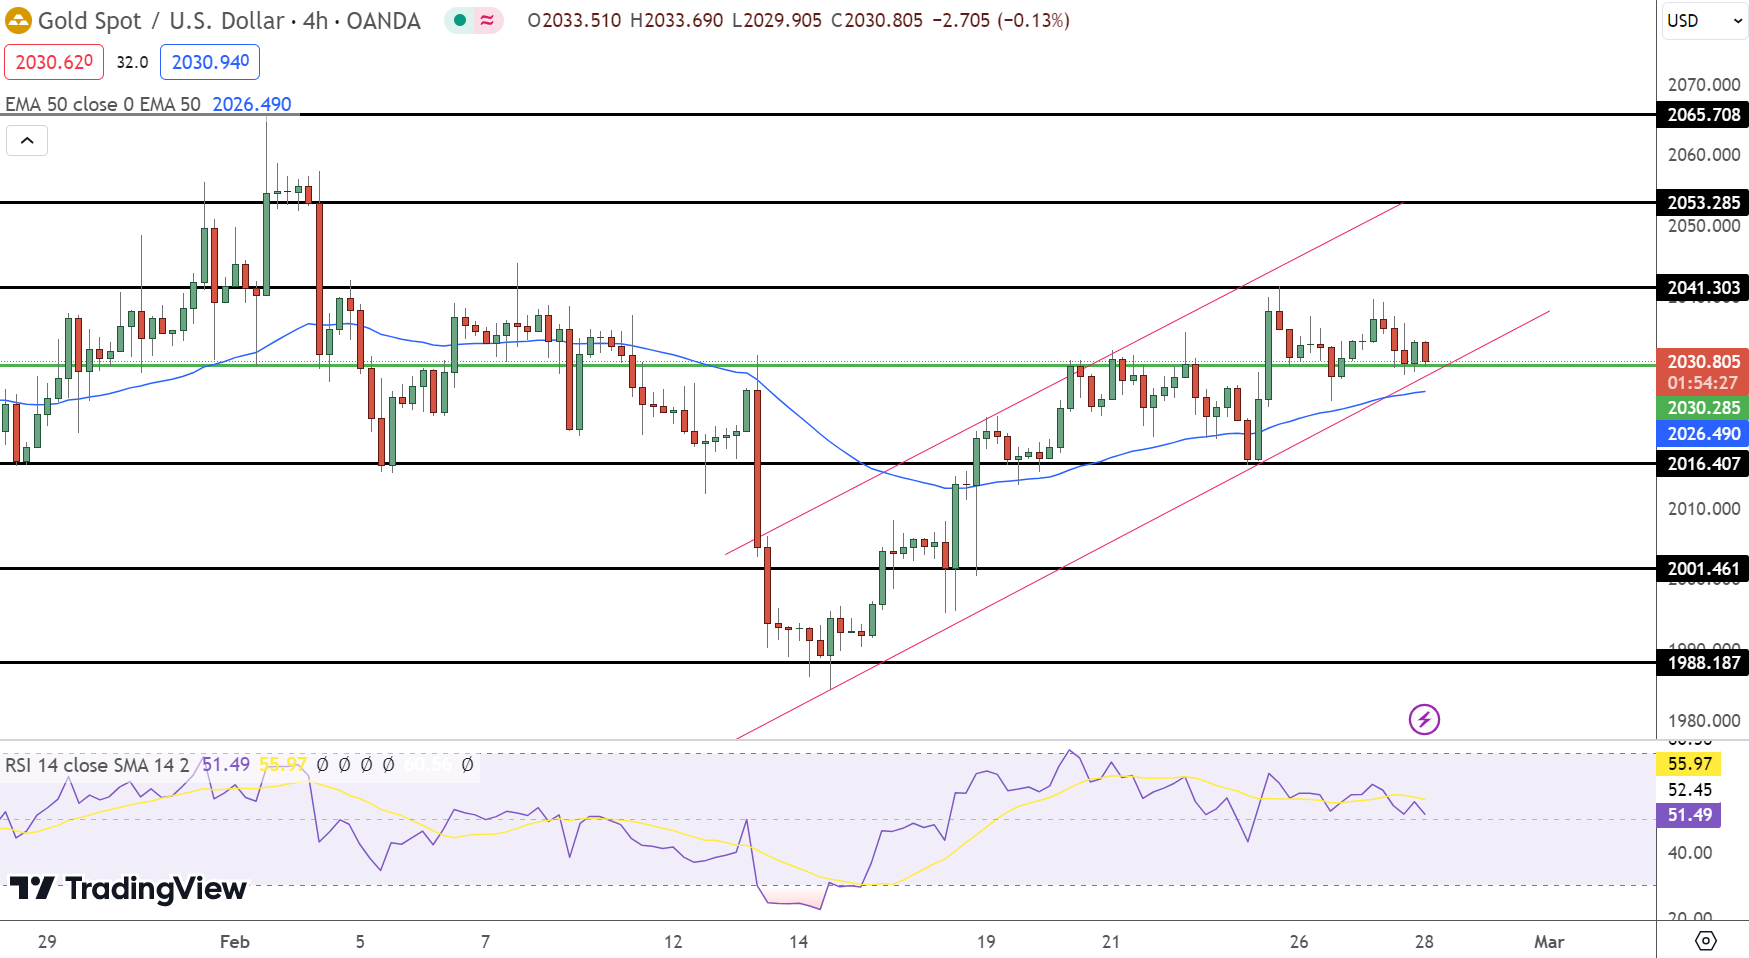
GOLD performance remained steady, trading at $2030.805 with no significant change from the previous day. This stability in gold prices suggests a cautious market sentiment as traders eye key support and resistance levels.
The pivot point at $2030.29 serves as a critical marker; prices above this level could signal bullish momentum, while a drop below could indicate bearish trends. Immediate resistance levels are set at $2041.30, $2053.29, and $2065.71, which could cap upward movements.

Conversely, support levels at $2016.41, $2001.46, and $1988.187 offer potential rebound zones. The 50-day EMA at $2026.490 and an RSI of 51 further support a potential upward trend, suggesting that buying above the pivot might yield gains.
Overall, gold’s current technical outlook is cautiously optimistic, with a bullish bias above the $2030.29 threshold.
- Check out our free forex signals
- Follow the top economic events on FX Leaders economic calendar
- Trade better, discover more Forex Trading Strategies
- Open a FREE Trading Account
- Read our latest reviews on: Avatrade, Exness, HFM and XM
Related Articles


Sidebar rates
Related Posts
Ava

