DXY US Dollar Index Declines 5th Session in a Row
The DXY declined for a fifth consecutive trading session, the Fed’s pivot point and poorer than expected data fulling the drop.
The DXY declined for a fifth consecutive trading session, the Fed’s pivot point and poorer than expected data fulling the drop.
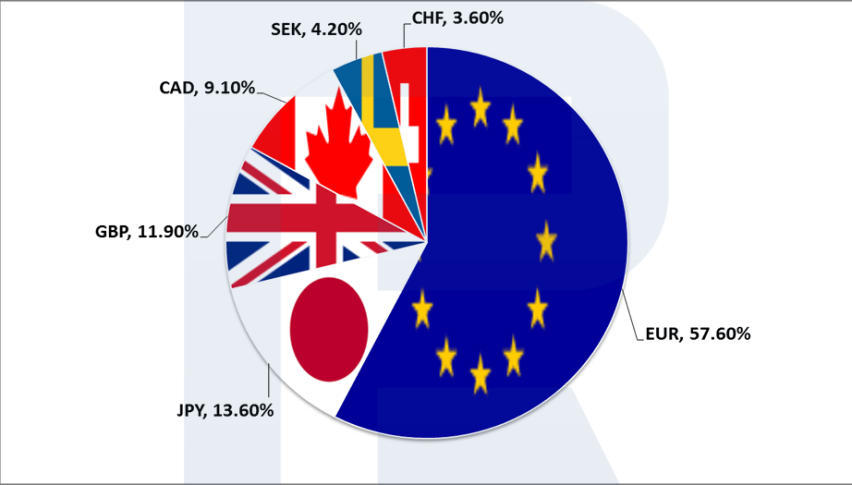
The US dollar has taken a beating over the past 5 sessions with most of the heat coming from the main trading currencies EUR, GBP, and JPY. Today’s session saw the DXY reach 102.85, levels not seen since January 24 this year.
The market is seeing a greater chance of a first cut in rates from the Fed in 1H, and they see it more likely that the Fed cuts rates before other main central banks. In particular, this week we have seen the ECB and the BoC both hold interest rates steady.
Both press conferences paved the way for traders to come to the conclusion that these central banks are not anywhere near as ready to cut rates as the Fed. The Loonie isn’t a heavyweight in the DXY basket of currencies.
However, the BoE also gave indications at its last meeting that the central bank would need more evidence of price stability before cutting rates. The going gets tough for the greenback when these 3 currencies above represent 78.6% weighting of the DXY index.
Technical Viewpoint
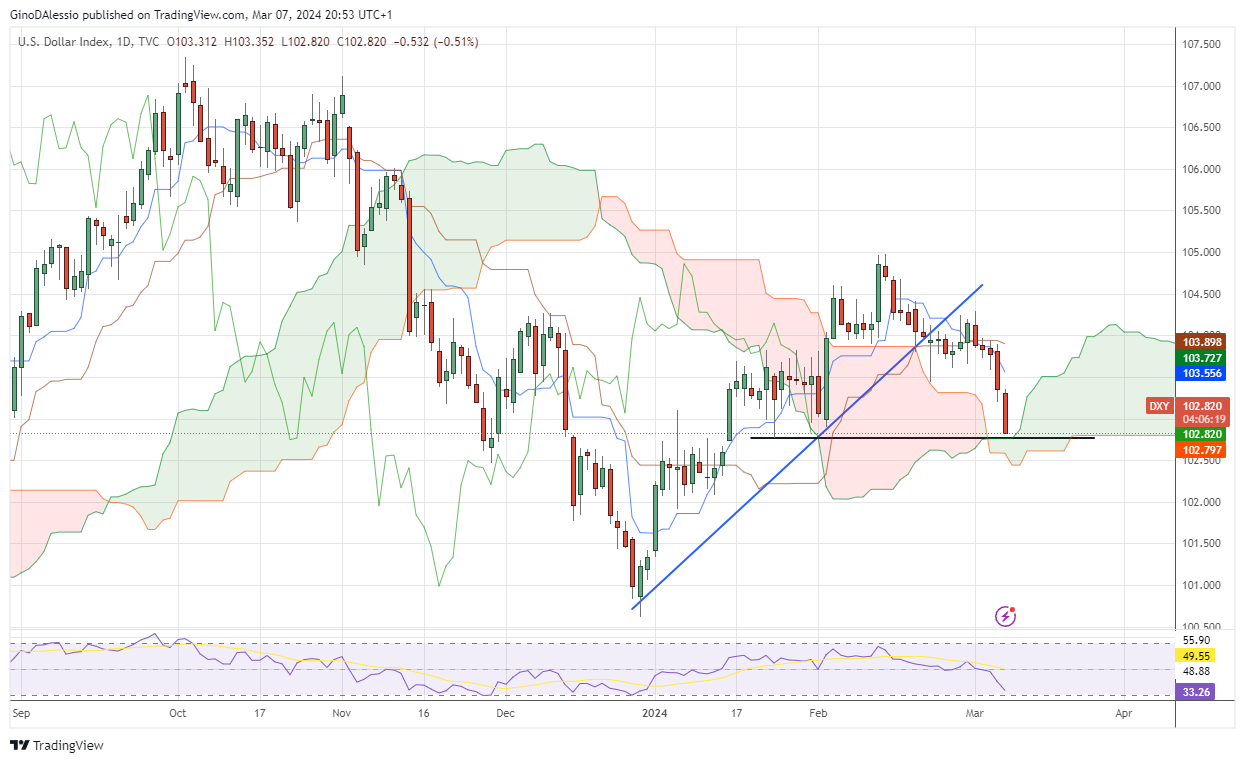
Today’s price action also seems to have reached a level that may offer some resistance. It’s also typical to see some consolidation or retracement after a sharp move. Looking at the day chart above we see that today’s candle is finding support at the top of the Ichimoku cloud.
But we can also see the cloud coincides with a support area defined by a low that happened last January and gave rise to the last leg of the rally that started in December 2023. So we might get a bounce here. But I would expect the market to continue lower on this index given the positive fundamentals of the main pairs, especially the Euro.
When I say positive fundamentals I’m really talking about the timing of interest rate cuts. The EU area economy is not doing as well as the US, but the ECB traditionally always lags behind the Fed in monetary policy.
[[EUR/USD-graph]]
- Check out our free forex signals
- Follow the top economic events on FX Leaders economic calendar
- Trade better, discover more Forex Trading Strategies
- Open a FREE Trading Account
- Read our latest reviews on: Avatrade, Exness, HFM and XM
Related Articles

Sidebar rates
Related Posts
