Forex Signals Brief April 10: RBNZ is Done, US CPI and BOC Coming Up
The USD is wrapping up the day as one of the weakest major currencies, second only to the EUR. However, despite this, the dollar has rebounded significantly from its earlier lows as selling pressure in US markets eased and buyers stepped in to take advantage of the dip. Lower interest rates have supported price activity in both Europe and the early US session.
Although yields remained lower by the day’s end, the currency market began to pay less attention to them and started to recover. EUR/USD exhibited increased volatility, with the pricereaching session highs at 1.0884 and surpassing the 100-day moving average. Meanwhile, in the US treasury market, yields remained lower despite a failed auction of three-year notes. Stock markets also turned negative and experienced a rather lackluster day overall.
Today’s Market Expectations
This morning the Reserve Bank of New Zealand (RBNZ) decided to maintain the cash rate at 5.50%, in line with market expectations. The central bank’s stance reflects their belief that interest rates need to remain elevated for an extended period to achieve their goal of returning consumer price inflation to within the target range of 1 to 3 percent this year. This decision underscores the RBNZ’s commitment to using monetary policy as a tool to manage inflationary pressures and ensure price stability in the economy, which sent the NZD 40 pips higher against the USD.
The US Consumer Price Index (CPI) year-on-year (Y/Y) is forecasted to be 3.4%, higher than the 3.2% recorded last year, while the month-on-month (M/M) figure is expected to be 0.3%, up from 0.4% in the previous year. Additionally, the Core CPI Y/Y is predicted to be 3.7%, slightly lower than the 3.8% recorded last year, with the M/M reading expected to be 0.3%, the same as the previous year. This upcoming CPI release is anticipated to be one of the most significant inflation reports of 2024. Previous data releases have already impacted the Federal Reserve’s confidence, and another strong release is likely to prompt a reassessment of the near-term policy outlook, particularly following a positive labor market report on Friday.
The Bank of Canada (BoC) is expected to maintain its interest rates at 5.00%. This decision comes after concerning labor market data released on Friday, which indicated job losses and an increase in the unemployment rate to 6.1% from 5.8%. Statistics Canada attributed the rise in the unemployment rate to an additional 60,000 individuals seeking work or on temporary layoff in March. The agency also reported that population growth reached its highest rate since 1957. Additionally, the BoC is monitoring wage growth closely. Unfortunately, the wage growth rate rose again to 5.1% from the previously positively adjusted 5.0% rate. However, there was some positive news as the latest inflation report fell short of estimates across various measures, showing significant softening in underlying inflation indicators.
Yesterday the US Dollar continued to retreat and volatility increased somewhat in the forex market, so we got caught on the wrong side in the stock market. But, made up in the afternooon with three winning signals, as Gold reversed back up after the retreat and the [rice hitthe take profit target of our buy Gold signal.
Gold Retreats but MAs Hold
The bullish momentum in gold has been remarkable throughout 2024, signaling strong positive sentiment in the precious metal market amid elevated global uncertainties. Surpassing the $2,300 mark and aiming for $2,500 demonstrates the confidence and resilience of buyers in the gold market. This trend underscores gold’s status as a safe-haven asset, especially during periods of economic turbulence. The recent climb to a record high of $2,330 further solidifies the bullish sentiment surrounding gold, indicating sustained demand and investor interest in the precious metal. Given the ongoing global tensions and economic uncertainty, gold remains an attractive option for investors seeking to hedge against potential risks and protect their wealth.
XAU/USD – 240 minute chart
EUR/JPY Remains Supported by MAs
USD/CHF has exhibited a bullish trend since the beginning of the year, experiencing a significant increase of over 5 cents and consistently holding above the 0.90 level. Yesterday, the unexpected uptick in the February unemployment rate, which rose from an anticipated 2.2% to 2.3%, contributed to a 50-pip surge in USD/CHF. This upward movement brought the pair closer to the 0.9050 level during European trading hours.
USD/CHF – H4 Chart
Cryptocurrency Update
Bitcoin Stays Close to $70K
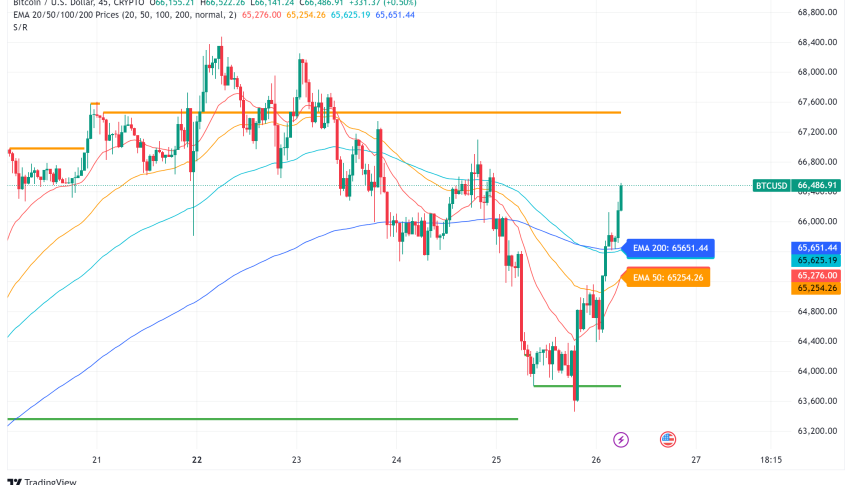
The struggle to sustain Bitcoin below $70,000 signifies strong buying momentum for BTC and the broader cryptocurrency market. This level serves as a critical resistance, indicating a potentially weakening bullish momentum. If buyers fail to sustain prices above this threshold, it may signal a decrease in demand and a shift in market sentiment. Moreover, the presence of a bearish reversal pattern on the daily chart supports the possibility of a price reversal. Such patterns often precede transitions from bullish to bearish sentiment, typically leading to further price declines. However, despite these challenges, the price managed to hold above $65,000 and bounced off the 50-day Simple Moving Average (SMA), returning to the $70,000 level again. This resilience suggests that buyers remain active and are willing to defend key support levels, potentially indicating ongoing bullish strength in the market.
BTC/USD – Daily chart
Ethereum Consolidate Above $3,000
The 50-period Simple Moving Average (SMA) has emerged as a significant support level for Ethereum, underscoring its importance in predicting price movements. As Ethereum’s price nears the 50-period SMA, the bounce observed from this level indicates the willingness of buyers to participate in the market and support the price. However, Ethereum has encountered resistance near the 20-period SMA, hindering further upward momentum. The 20-period SMA acts as a barrier to higher price advancement, suggesting the presence of either selling pressure or insufficient bullish momentum to propel Ethereum’s price beyond this threshold. Additionally, a negative reversal occurred on Tuesday, causing the price to approach $3,000 but ultimately halting above the March lows. These technical dynamics depict a tug-of-war between buyers and sellers in the Ethereum market, with the 50-period SMA providing support while the 20-period SMA presents resistance. We are closely monitoring these moving averages and price levels for potential shifts in market sentiment and direction, especially since we are already long on ETH/USD.
ETH/USD – Daily chart
| Broker | Website | |
|---|---|---|
| 🥇 |  | Visit Broker >> |
| 🥈 |  | Visit Broker >> |
| 🥉 |  | Visit Broker >> |
| 4 |  | Visit Broker >> |
| 5 |  | Visit Broker >> |
| 6 |  | Visit Broker >> |
| 7 |  | Visit Broker >> |


