Gold Price Hits $2,400 Amid Rising Middle East Tensions, Bullish Market Outlook
In a recent session, the Gold price (XAU/USD) has extended its prevailing upward trajectory, reaching a new zenith at approximately $2,400
In a recent session, the Gold price (XAU/USD) has extended its prevailing upward trajectory, reaching a new zenith at approximately $2,400 during the Asian market hours on Friday.
This climb is primarily propelled by heightened geopolitical tensions in the Middle East, where further escalation is anticipated. Such uncertainties substantially enhance the appeal of Gold as a preferred safe-haven asset.
Event Highlight: Middle East Tensions Escalate
Investors are particularly attuned to developments in the Middle East, where an expected Iranian retaliation following a presumed Israeli attack on its Syrian embassy underscores the regional instability. This geopolitical strife has catalyzed the recent surge in Gold prices to record highs.
Despite a robust performance by the US Dollar, influenced by shifting expectations towards Federal Reserve policy, Gold’s allure remains undiminished. Initial forecasts of a rate cut as early as June have been deferred to September, according to recent consumer inflation data.
Moreover, market projections have scaled back the anticipated number of rate cuts this year, which now stands at less than two, down from the previously expected three to four.
Market Dynamics: Fed’s Policy and Inflation
The sustained bullish sentiment in Gold markets is further bolstered by the prospect of reduced interest rates by major central banks. Such an environment is generally favourable for non-yielding assets like Gold.
However, traders might exercise caution due to the “extremely overstretched” conditions indicated in various time frame analyses, which could potentially temper new bullish positions in the near term.
Upcoming Influencers: Economic Indicators and Fed Comments
Looking forward, the imminent release of the Preliminary Michigan Consumer Sentiment Index, alongside upcoming speeches by influential members of the Federal Open Market Committee (FOMC), is expected to influence the US Dollar’s strength and, consequently, create short-term trading opportunities in Gold. These events will be closely monitored by investors for their potential impact on market dynamics.
Recent Data Insights: PPI and FedWatch Tool
Recent economic indicators, such as the cooler-than-expected US Producer Price Index, maintain optimism for an impending rate reduction by the Federal Reserve, providing additional impetus to the Gold market.
Data from the CME Group’s FedWatch tool suggests a conservative outlook on the timing of rate cuts, aligning expectations with a potential commencement in September.
As we observe the interplay between Federal Reserve policy statements and economic data, the position of Gold in the financial markets continues to be a focal point of interest, driven by its inherent safe-haven qualities and the macroeconomic landscape.
Gold Price Forecast: Technical Outlook
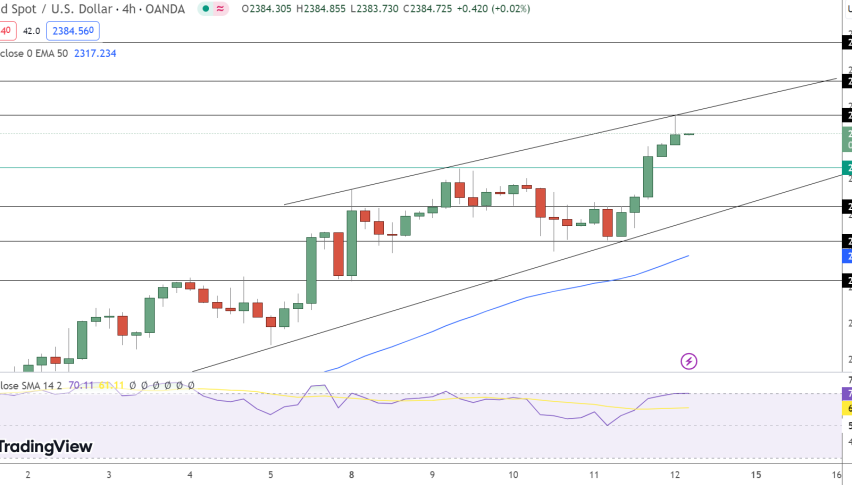
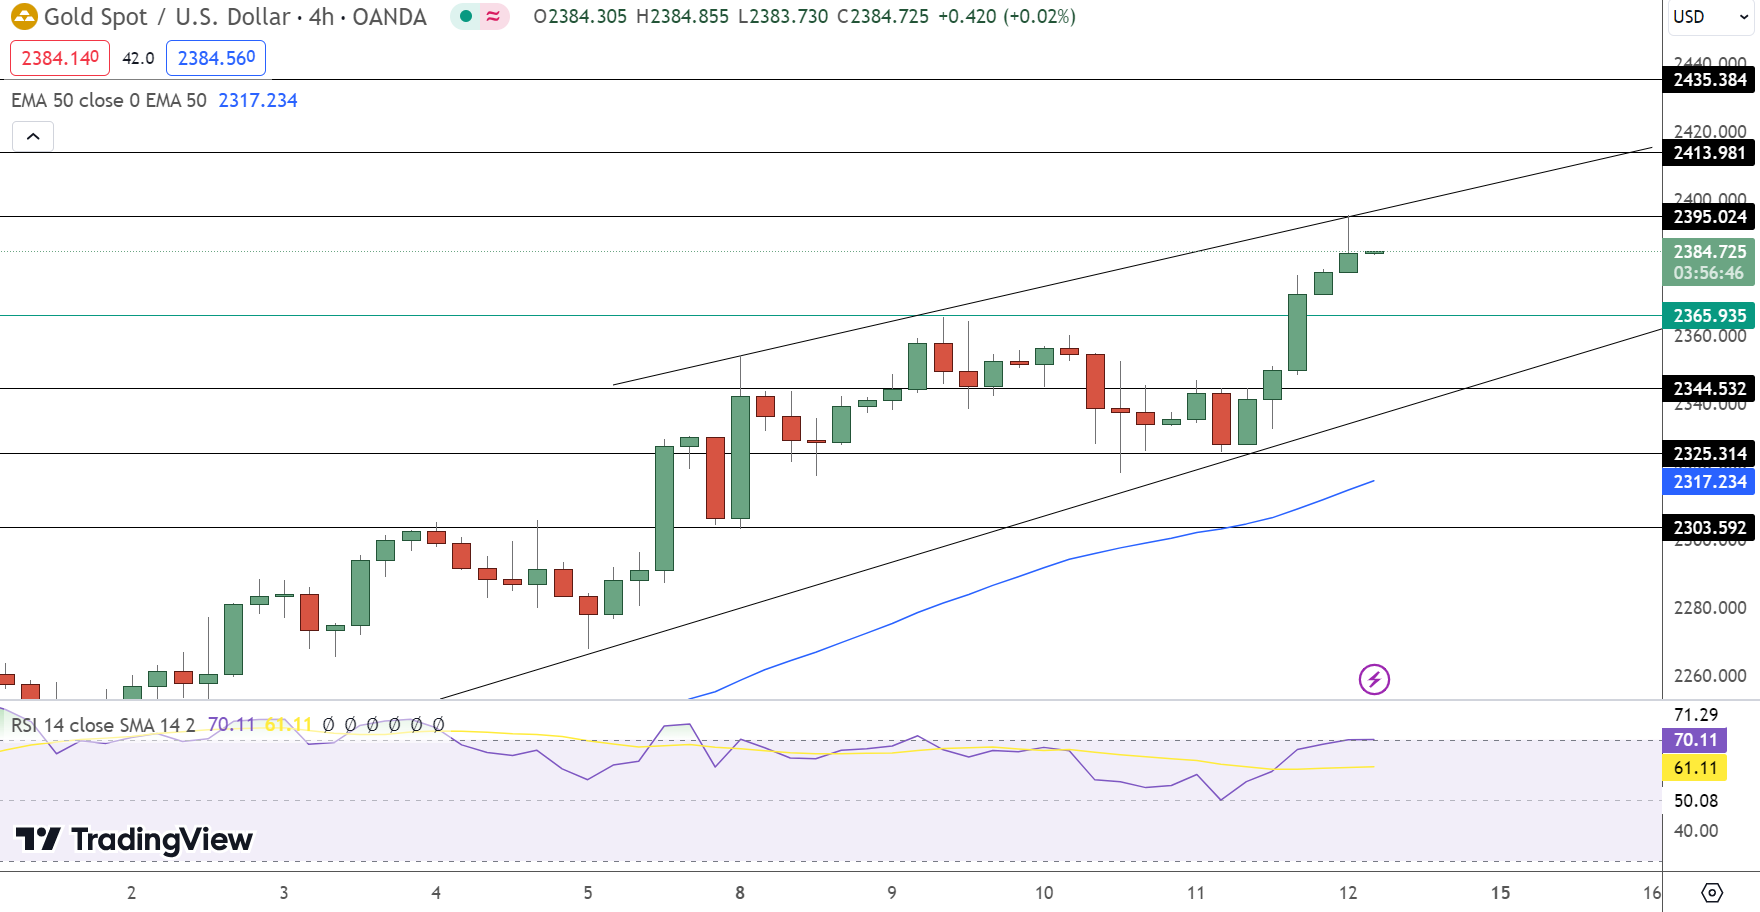
In today’s analysis, Gold (XAU/USD) is observed with a slight uptick, currently trading at $2384.73, a 0.57% increase. Noteworthy is the pivot point at $2365.94, acting as a foundational support level.
The technical layout presents immediate resistance at $2395.02, with subsequent barriers at $2413.98 and $2435.38. Conversely, support levels are established at $2344.53, followed by $2325.31 and $2303.59.
The Relative Strength Index stands at 70, indicating that Gold is approaching overbought conditions, suggesting potential resistance encounters. The 50-day Exponential Moving Average at $2317.23 reinforces a positive trend.
In conclusion, the outlook for Gold remains bullish as long as it sustains above the pivot point of $2365.94. However, a drop below this threshold could precipitate a sharp selling trend, warranting close observation of potential shifts in market dynamics.
- Check out our free forex signals
- Follow the top economic events on FX Leaders economic calendar
- Trade better, discover more Forex Trading Strategies
- Open a FREE Trading Account
- Read our latest reviews on: Avatrade, Exness, HFM and XM
Related Articles


Sidebar rates
Related Posts
