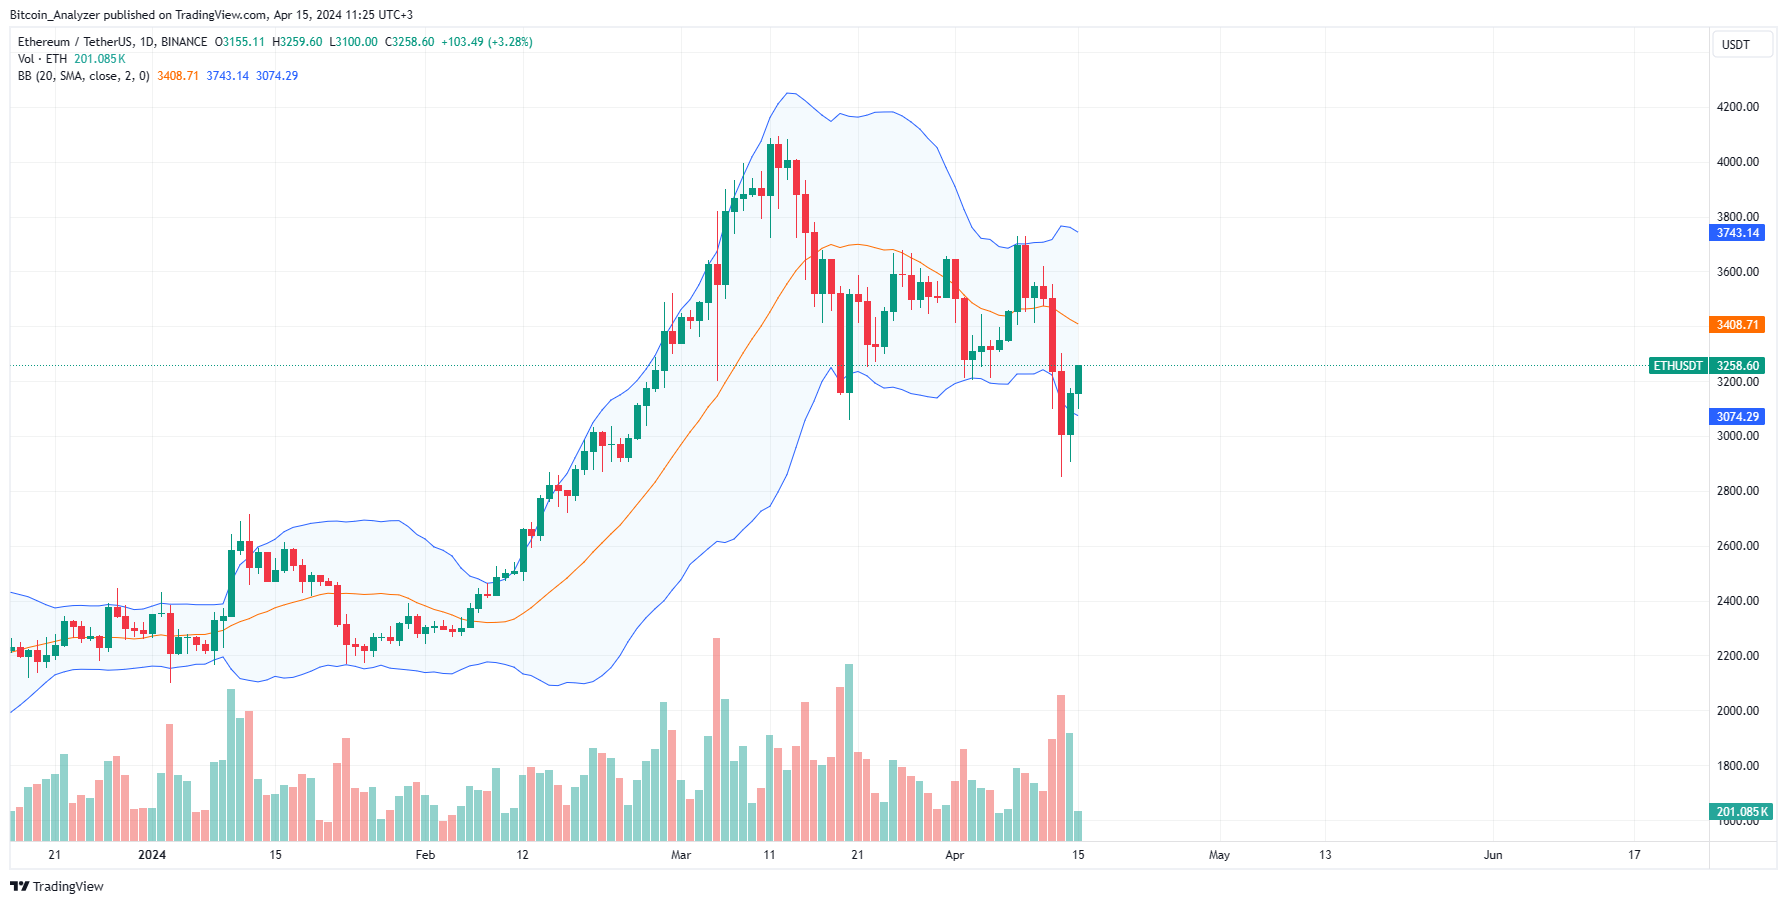
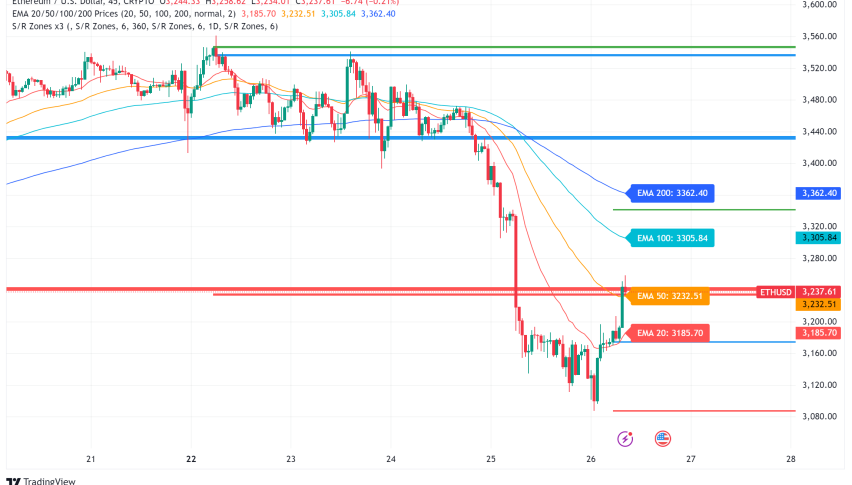
Ethereum is trading up when writing. Changing hands above $3,200, the coin is recovering but technically under pressure, trending within the April 13 bear bar. From the candlestick arrangement in the daily chart, ETH is within a bear breakout formation following the weekend’s losses. However, with the bounce on Sunday and the extension in the early Asian session, prices look solid.
On the last trading day, ETH is up 5%, while it is down 8% in the past week. Although prices are steady at press time, volume is down 32%, meaning traders are still cautious and unwilling to participate. In the days to come, this might change, influenced by changes in trend direction. Losses or gains above key levels, clear in the daily chart, might see trading volume expand.

Going forward, the following news events will shape Ethereum prices in the days ahead:
- Hong Kong regulators have approved spot Ethereum and Bitcoin ETFs, a major boost and endorsement of crypto assets. The decision on April 15 might catalyze demand, helping ETH prices soak in the wave of selling pressure of the weekend.
- The Chainlink Cross-Chain Interoperability Protocol (CCIP) has been expanded to support Ethereum layer-2 platforms, including Optimism. CCIP promotes blockchain interoperability, helping make the ecosystem more fluid.
Ethereum Price Analysis
ETH/USD is firm, adding 5% on the last day, as mentioned earlier.
However, following the dump below $3,200 over the weekend, it means the coin is technically within a bear breakout formation.
Prices are still within the April 13 bear bar, a net bearish from an effort versus result perspective.
From the Ethereum candlestick arrangement in the daily chart, the primary resistance is at $3,700.
This level must be broken at the back of rising volume for buyers to take over.
Further contractions below last week’s lows of $2,860 will likely see Ethereum fall to $2,600.


