XAU/USD: Gold Halts its Rise and Turns Negative – Geopolitical Risks Keep Buyers Interested, But Fed Policy Weighs
The current bull trend started on Monday 10, 2023 and has continued higher as the situation in the Middle East has deteriorated. No doubt th


After yesterday’s ranged market, gold started to float lower today. The risk of Israel’s threats of an attack on Iran faded. Allowing hawkish Fed sentiment to weigh on gold prices.
The current bull trend started on Monday 10, 2023 and has continued higher as the situation in the Middle East has deteriorated. No doubt the threat of extended armed conflict has sent many investors into a safe haven asset such as gold.
The rally has also benefited from reports of continued central bank buying activity in 2024. In January 2024, the World Gold Council published a report that should an average net buying, from January to November 2023, from central banks of 36 tons.
There have been various reports and rumors adding to the fuel that has stoked this run on gold. However, the BRICS organization has repeatedly stated its intention of launching a trade currency backed by gold, and this could explain the central bank activity.
Weighing on gold prices over the past few days has been the shift in sentiment on when the Federal Reserve’s change in monetary policy may actually happen. The recent rise in the US dollar will also have hampered gold prices, as gold exporters get more of their local currency, which offsets lower US dollar gold prices.
Technical View
The day chart below for XAU/USD shows a clear bull trend. However, there are various factors that indicate a correction may be about to take place. Yesterday’s close is a Doji star, which is particularly accurate in predicting a change in direction when we see them on the day chart.
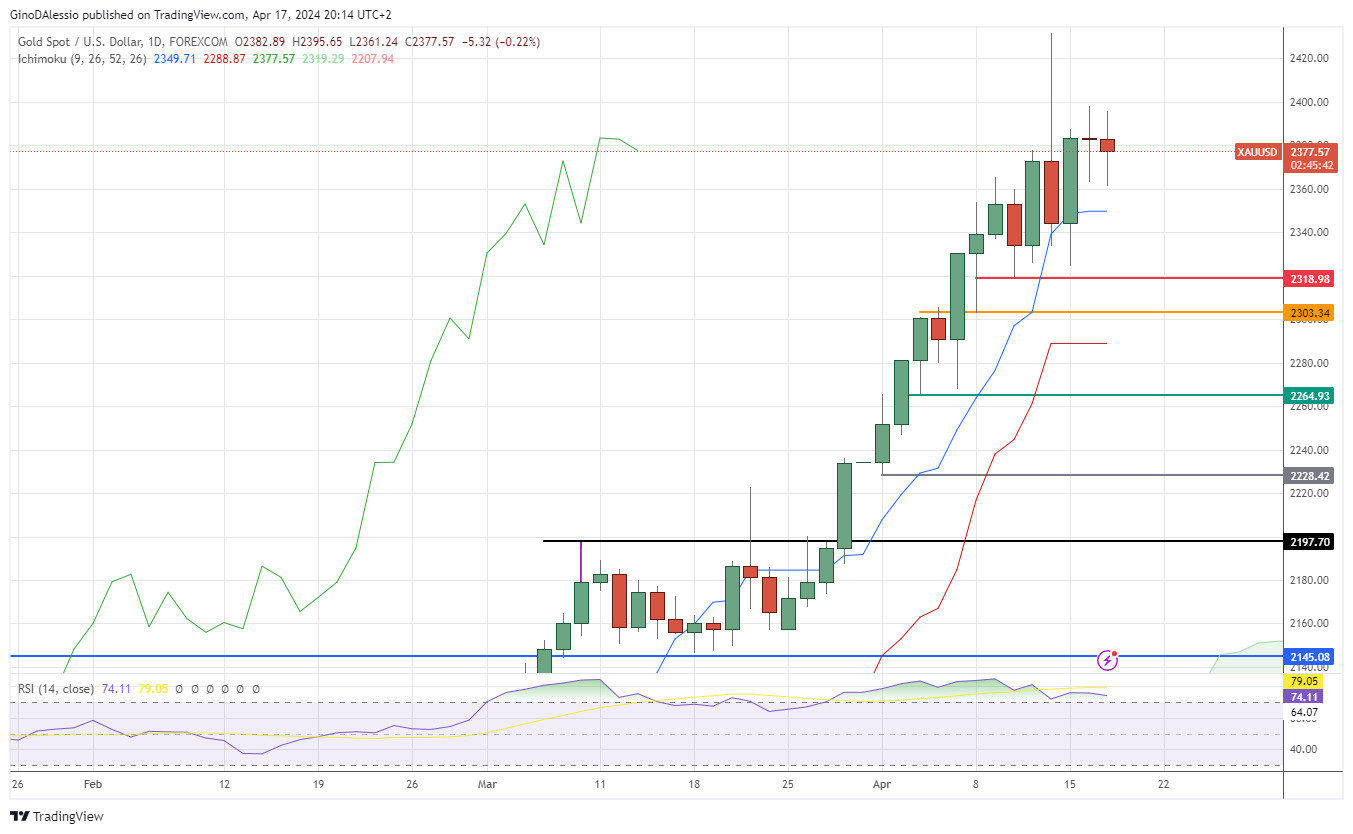
The RSI is over 70, at 73.34 and indicates overbought territory. Although we would need a close below 70 to signal a retracement may happen. However, the fact we are analyzing the day time- frame makes these levels for the RSI important.
We are also far away from the Ichimoku cloud, which acts as a magnet and tends to drag price back toward it. Today’s candle is over $270, 13% higher than the topside of the cloud. From experience, gold prices tend to bounce back after travelling at most 10% away from the cloud. So, this factor is telling us that a retracement is well overdue.
If the correction does materialize, I see the next support level between $2,318 (red line) and $2,303 (orange line). If instead, the market continues higher, the next resistance is at the all-time high of $2,431.
- Check out our free forex signals
- Follow the top economic events on FX Leaders economic calendar
- Trade better, discover more Forex Trading Strategies
- Open a FREE Trading Account
- Read our latest reviews on: Avatrade, Exness, HFM and XM
Related Articles


Sidebar rates
Related Posts
