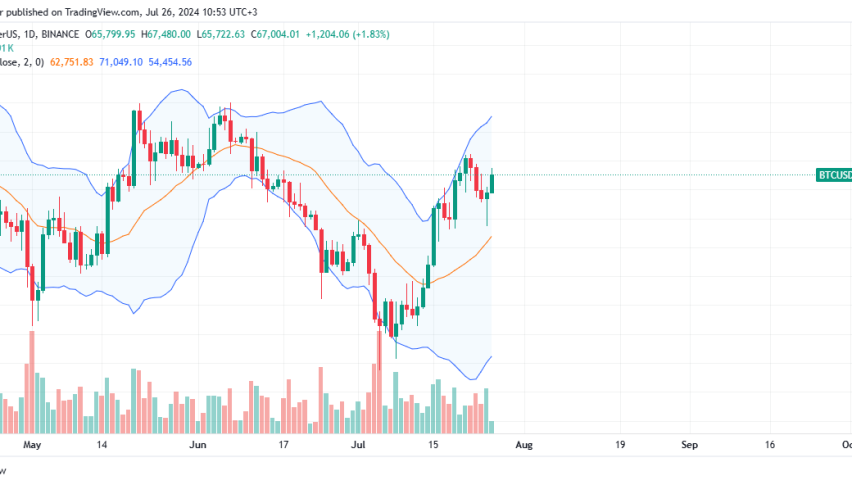
The Bitcoin sell-off is not slowing down, at least looking at the performance in the daily chart. After a brief consolidation period, BTC fell harder on April 17, extending losses and inducing more pain for HODLers. At the current formation, it is evident that sellers have the upper hand, and the coin could slump even more if buyers fail to plug the bleed.
Bitcoin is down 3% in the past trading day and 13% in the previous week. Overall, the path of least resistance is southwards in the short term. Though buyers are still in control from a top-down preview, further losses today might weaken the grip of bulls, turning the tide around. In the past 24 hours, the average trading volume stands at $42 billion, up 9%.

Traders are looking at fundamental factors. The following Bitcoin news might influence price action:
- Inflows into spot Bitcoin ETFs continue to slow down. In the past day, there have been more outflows from GBTC, which is unwinding and converting the product into an ETF. At the same time, BlackRock is accumulating more BTC and may soon flip GBTC, a net positive for price.
- Halving is less than 36 hours from now. Once it happens, a supply crisis is expected. While its impact might not be immediate, prices might benefit if the current demand is sustained. In the meantime, there are concerns about possible miner centralization.
Bitcoin Price Analysis
BTC/USD is under pressure at spot rates.
With more outflows from GBTC, the coin is selling off hard. This can only be countered by more inflows into spot Bitcoin ETFs; creating demand.
Considering the current candlestick arrangement, every high might offer entries for sellers targeting $60,000.
From the daily chart, if Bitcoin breaks below $60,000, confirming the bear breakout of April 13, the coin might slip to as low as $53,000 in the near term.


