S&P 500 Price Forecast: Dips to $5010 Amid Fed Hawkishness and Middle East Tensions
The S&P 500 index, which represents 500 large-cap stocks, has recently shown a bearish trend, currently situated around 5,011.
The S&P 500 index, which represents 500 large-cap stocks, has recently shown a bearish trend, currently situated around 5,011. This downward movement is primarily influenced by escalating geopolitical tensions in the Middle East and a hawkish monetary stance from the Federal Reserve.
After Israeli missile strikes in Iran were reported, concerns over potential regional conflicts have intensified, adversely affecting global market sentiments.
Impact of Geopolitical Tensions on Market Stability
The increased geopolitical uncertainty, especially the conflict between Israel and Iran, is prompting investors to shift their focus towards safe-haven assets such as gold, detracting from equity investments including those in the S&P 500.
This reallocation is part of a broader risk-off movement in financial markets, contributing to the index’s recent declines.
Federal Reserve’s Hawkish Outlook Weighs on Equities
Further impacting the S&P 500 is the Federal Reserve’s persistent concern over inflation, with officials indicating the likelihood of prolonged higher interest rates to combat price rises.
Such a stance discourages investment in equities due to the increased cost of borrowing and the appealing yields in fixed-income markets, which typically lure capital away from the stock market.
S&P 500 Technical Analysis and Trading Strategy
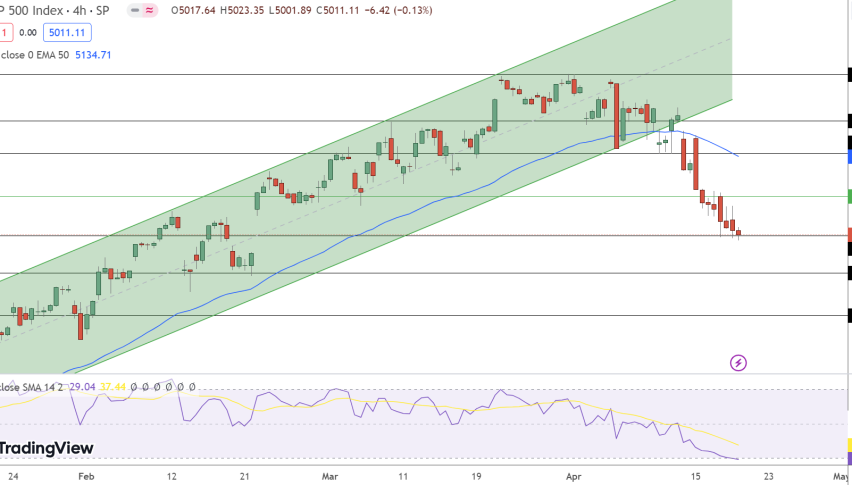
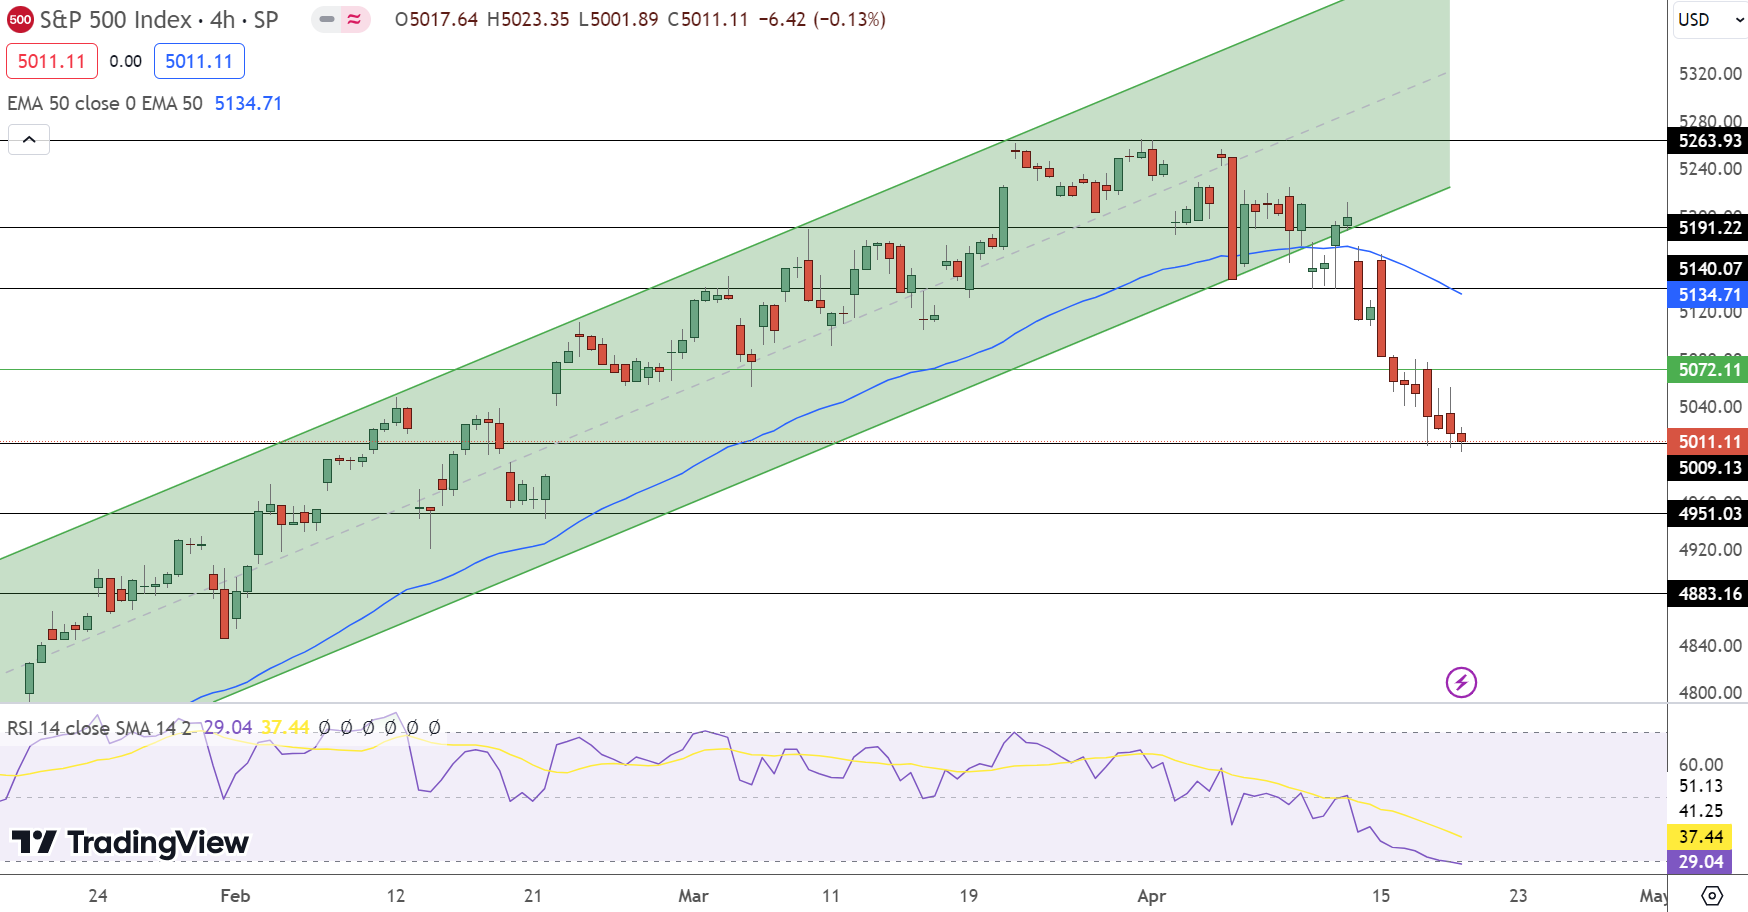
Technically, the S&P 500 is trading below its pivot point at $5039.76, signalling bearish pressures with resistance levels awaiting at $5080.78, $5138.22, and $5205.92. Support levels are found at $4983.34 and further down at $4920.77 and $4845.90, which could offer some stabilization.
The Relative Strength Index (RSI) at 29 suggests an oversold market condition, potentially hinting at a rebound or at least temporary stabilization. However, the significant gap below the 50-day EMA of 5172.41 underscores the prevailing bearish trend.
In response, traders might consider short positions below $5040, targeting $4965, while employing a stop loss at $5100 to mitigate risks associated with unexpected market reversals.
- Check out our free forex signals
- Follow the top economic events on FX Leaders economic calendar
- Trade better, discover more Forex Trading Strategies
- Open a FREE Trading Account
- Read our latest reviews on: Avatrade, Exness, HFM and XM
Related Articles


Sidebar rates
Related Posts
Ava

