Bitcoin Price Stalls After Halving, Eyes Resistance at $66,000
Bitcoin (BTC) has encountered resistance after a recent surge that took it above $64,000. The world's leading cryptocurrency is currently
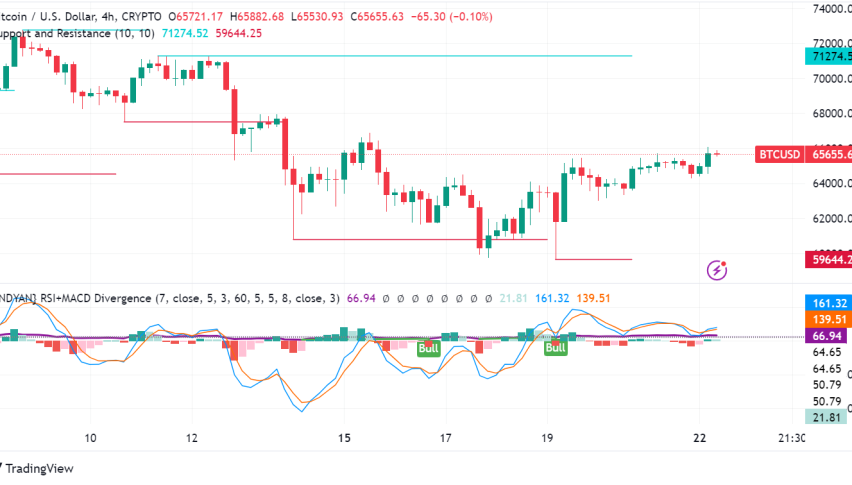
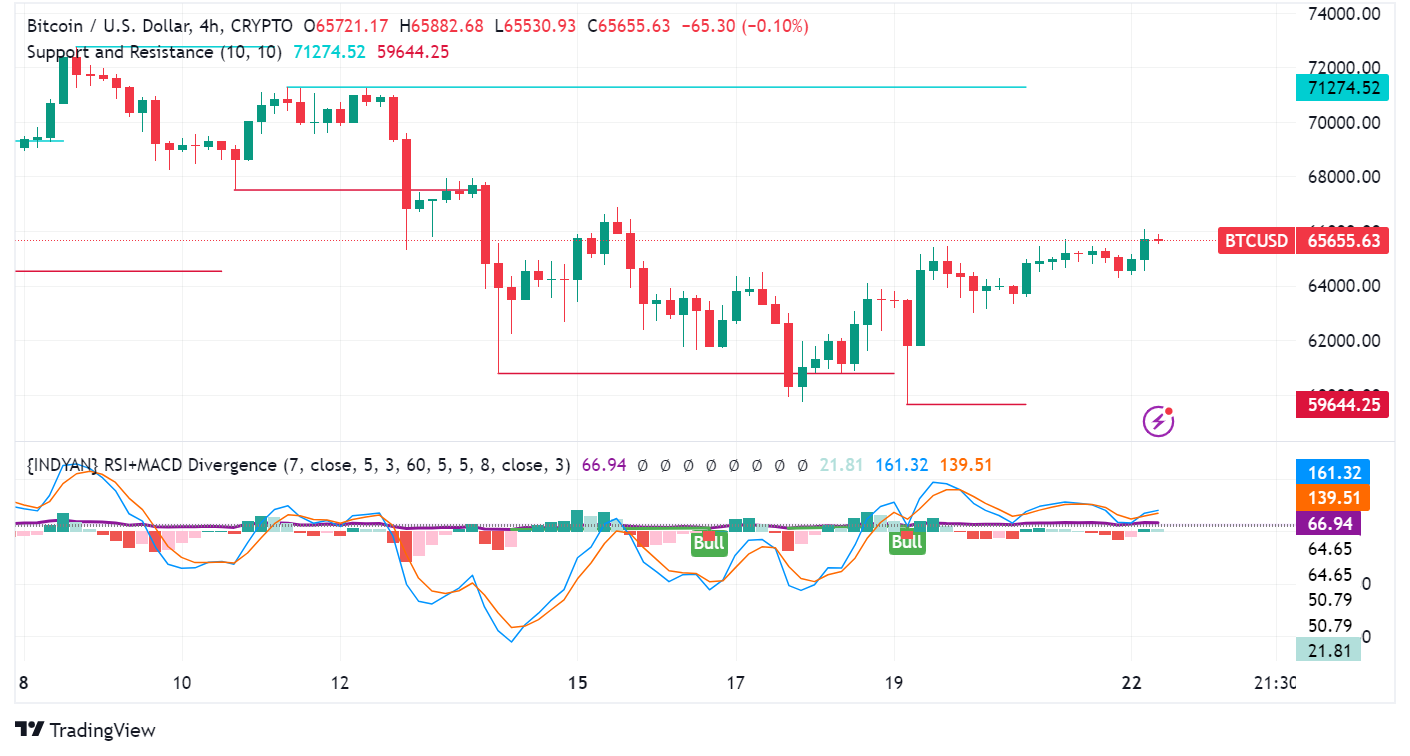
Bitcoin (BTC) has encountered resistance after a recent surge that took it above $64,000. The world’s leading cryptocurrency is currently trading around $65,700, facing hurdles near $66,000.
Bitcoin Mining Firms See Share Price Surge
Several Bitcoin mining companies listed on the Nasdaq witnessed significant gains in their share prices leading up to the halving event on April 20th. Riot Platforms (RIOT) led the surge with a 10.13% increase, followed by Marathon Digital (MARA) at 9.78%.
Bitcoin Transaction Fees Plummet After Halving
The average transaction fees for Bitcoin transactions have dropped sharply to around $8-$10, down from a record high of $128 on April 20th. This decrease suggests less congestion on the network after the block reward reduction.
Analyst Sees Buying Opportunity Based on MVRV Ratio
A prominent crypto analyst, Ali Martinez, believes Bitcoin’s Market Value to Realized Value (MVRV) ratio indicates a potential buying opportunity with a historical average gain of 67% following similar dips.
Overall, Bitcoin’s post-halving price action remains uncertain. While technical analysis suggests a possible breakout, resistance levels pose a challenge. The coming days will be crucial in determining the direction of Bitcoin’s price movement.
BTC/USD Technical Analysis Hints at Potential Breakout
A contracting triangle pattern on the hourly chart suggests a potential breakout if Bitcoin surpasses $66.000. The price is holding above the 100-hour Simple Moving Average (SMA), indicating some buying pressure.
Resistance Levels Loom
A clear break above $66,000 could propel Bitcoin towards $67,500 and potentially even $70,000 in the near term.
Support Levels in Case of Pullback
If Bitcoin fails to overcome resistance, it could experience a correction towards $64,500. The next major support level sits at $64,000, followed by $62,500.
Technical Indicators Offer Mixed Signals
The MACD (Moving Average Convergence Divergence) on the hourly chart is losing momentum in bullish territory. The RSI (Relative Strength Index) is hovering near 50, indicating neither overbought nor oversold conditions.
- Check out our free forex signals
- Follow the top economic events on FX Leaders economic calendar
- Trade better, discover more Forex Trading Strategies
- Open a FREE Trading Account
- Read our latest reviews on: Avatrade, Exness, HFM and XM
Related Articles


Sidebar rates
Related Posts
