Forex Signals Brief May 3: USD Buyers Waiting for A Strong NFP
Today all traders are focused on the NFP report, which is expected to show at 238K

The Japanese yen has been in the spotlight since the intervention, resulting in aggressive price action. The selling pressure intensified again yesterday after the overnight bounce, pushing the pair below 153.00. There may be hesitancy to buy the falling knife ahead of non-farm payrolls or potential further action which will be released later today.

The USD on the other hand saw further retreat as the market priced in 40 bps of Fed cuts this year, compared to 30 basis points prior to the FOMC statement. US bond yields decreased as stocks turned bullish in the US session, putting pressure on the dollar. Commodity currencies, especially the AUD, strengthened as Chinese equities surged on their strongest day in six months.
Most currencies are near its weekly highs, rebounding gradually after a challenging day on Tuesday. The EUR and GBP hit bottom in European trading before recovering during the US session to erase all losses and finish marginally higher for the day. The Euro has shown resilience in the face of recent dollar buying, despite the ECB rate cut in June highly probable.
Today’s Market Expectations
Today the main event is the US Non-Farm Payrolls (NFP) report, which is expected to show an addition of 238,000 jobs in April, down from 303,000 in March, while the unemployment rate is projected to remain steady at 3.8%. The month-over-month average hourly earnings are predicted to be 0.3%, the same as the previous month, but there is no consensus yet on the year-over-year figure. The last report showed a decrease to 4.1% from 4.3%. The overall expectations for the report will be influenced by other job data released this week. We have recently seen mixed signals, with strong jobless claims but poorer statistics in the NFIB Hiring Intentions and S&P Global PMIs. The focus will also be on wage growth, as a robust report with declining wage growth may foster bullish risk sentiment, while an increase is likely to prompt a hawkish reaction.
The US ISM Services Purchasing Managers’ Index (PMI) is expected to rise to 52.0 points, up from 51.4 points previously. Last month, the index fell short of expectations due to a broad decline in the sub-indices, particularly the pricing component, which reached its lowest level since March 2020. The most recent S&P Global US Services PMI also fell short of estimates. Commentary has been pessimistic, with reports of elevated layoff activity, although there have been some positive developments on the inflation front. The price and employment sub-indices will be the most crucial data points to monitor.
Yesterday the volatility wasn’t too high but there was enough price action to pull several trading signals. However, there were a few reversals during the day, which made it difficult somewhat. We opened five forex signals in total, ending the day with three winning forex signals and two losing ones.
Gold Climbs Back Above $2,300
GOLD prices had been consolidating above $2,300 for several days after declining from levels above $2,400. Buyers maintained prices within the range of $2,310 to $2,350. However, XAU resumed its decline, dropping below $2,300. The easing of geopolitical tensions has improved risk sentiment in financial markets, leading to reduced demand for gold. However, following the Federal Open Market Committee (FOMC) meeting yesterday, gold prices once again rose above $2,300.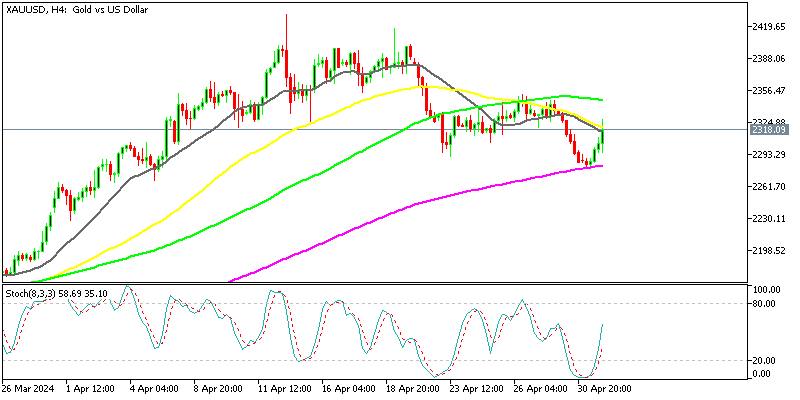
XAU/USD – Daily chart
Enormous Volatility in USD/JPY After Another BOJ Intervention
GBP/USD experienced a decline of 6 cents during the first week of March. This drop happened after encountering resistance at the 200-weekly Simple Moving Average (SMA), with moving averages (MAs) also acting as resistance on the daily chart. The decline occurred swiftly, but over the last two weeks, buyers of GBP/USD have emerged, pushing the price upwards. However, they are encountering resistance at the 200 daily SMA (purple) after the pair reversed following the FOMC meeting, which was not as hawkish as traders had feared. 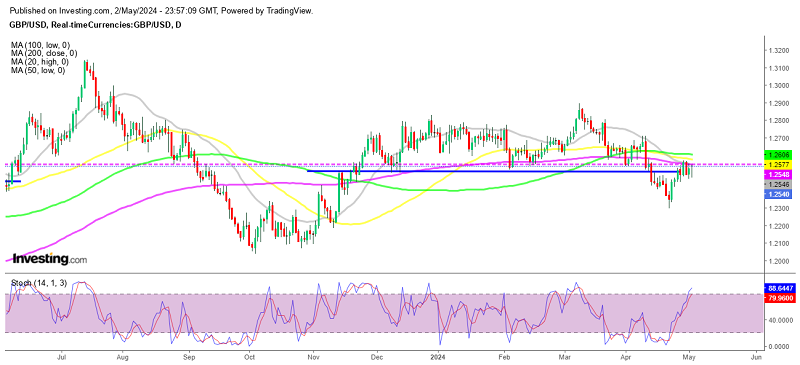
GBP/USD – Daily Chart
Cryptocurrency Update
Buying the Dip in Bitcoin at the 100 Daily SMA
Bitcoin has slipped below $60,000 after rallying back to $68,000, marking the first dip below this level. BTC is currently trading at the 100 Simple Moving Average (SMA) (green line), which serves as support on a daily basis. During this decline in BTC/USD, we issued a buy signal, expecting the Bitcoin price to rebound towards $70,000.
BTC/USD – Daily chart
Ethereum Stuck Between 2 MAs
Ethereum dropped below $3,000, breaking the 100-day Simple Moving Average (SMA) on the daily chart. However, it later managed to recover and climb back above $3,000. Despite making significant gains, the upward momentum of buyers stalled near the 50-day SMA (yellow line), leading to a reversal. While the 100 SMA (green) was breached this week, the price did not stray far from it and remains in close proximity.
ETH/USD – Daily chart
- Check out our free forex signals
- Follow the top economic events on FX Leaders economic calendar
- Trade better, discover more Forex Trading Strategies
- Open a FREE Trading Account
- Read our latest reviews on: Avatrade, Exness, HFM and XM
Related Articles


Sidebar rates
Related Posts
