USD/CAD Price Forecast: Hits 1.3715 Amid US Dollar Strength and Canadian Economic Woes
During the European trading session on Tuesday, the USD/CAD pair reversed its recent decline, climbing to an intra-day peak of 1.3715.
During the European trading session on Tuesday, the USD/CAD pair reversed its recent decline, climbing to an intra-day peak of 1.3715.
This uptrend was driven by a resurgence in the strength of the US dollar, bolstered by unexpectedly robust US payroll figures, rising consumer price inflation, and assertive comments from the Federal Reserve.
These factors prompted investors to temper their expectations for imminent US interest rate cuts. In contrast, a decrease in Canadian industrial produce prices suggested a slowdown in economic activity or diminished demand for Canadian exports, which negatively impacted the CAD.
US Dollar Resilience Bolsters USD/CAD Price Forecast
In the US, the dollar’s strength continued unabated, underpinned by diminishing prospects of Federal Reserve rate cuts. Recent strong US economic indicators, including payroll data and CPI figures, alongside hawkish rhetoric from the Fed, have led to a recalibration of market expectations.
Now, anticipated rate cuts are likely delayed until September, with fewer reductions expected than initially thought. This scenario has not only supported the US dollar but also indirectly influenced commodities like silver.
Monitoring Key US Economic Indicators
Market participants are keeping a close watch on pivotal US economic reports such as the S&P Global Purchasing Managers Index (PMI), Gross Domestic Product (GDP), and Core Personal Consumption Expenditures (PCE).
Positive outcomes from these indicators have fostered a sense of optimism, further enhancing the bullish outlook for the USD/CAD pair.
Canadian Economic Indicators Weigh on CAD
Data released by Statistics Canada revealed that Canadian Industrial Produce Prices fell by 0.8% in March, aligning with expectations but marking a decrease from the previous month’s revised 1.1% rise. This decline coincided with a decrease in WTI oil prices, a significant concern given Canada’s role as a major oil exporter to the US.
Moreover, the upcoming release of Canada’s Retail Sales data on Thursday is projected to show a modest improvement of 0.1% for February, a potential positive shift from January’s 0.3% decline.
Thus, the current downturn in Canadian industrial produce prices coupled with fluctuating oil prices could further weaken the CAD against the USD, influencing the USD/CAD price dynamics.
Moving forward, the upcoming Canadian retail sales figures will be crucial in shaping market perceptions regarding economic recovery and its effects on the USD/CAD price trajectory.
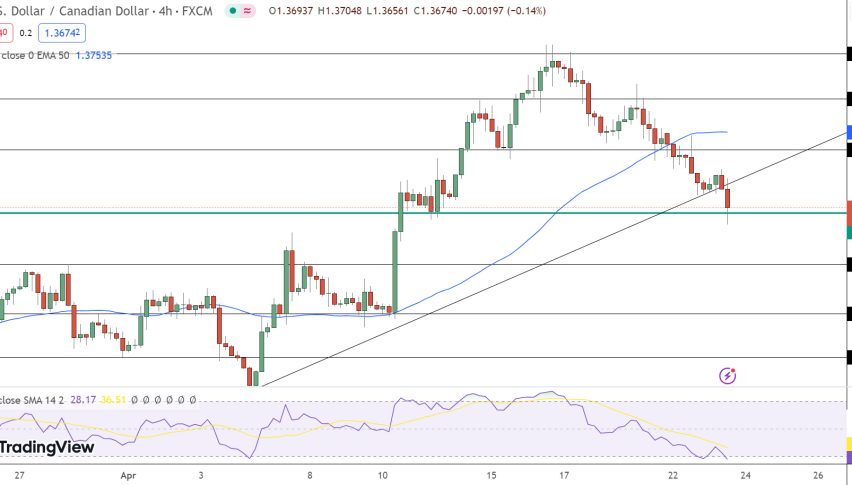
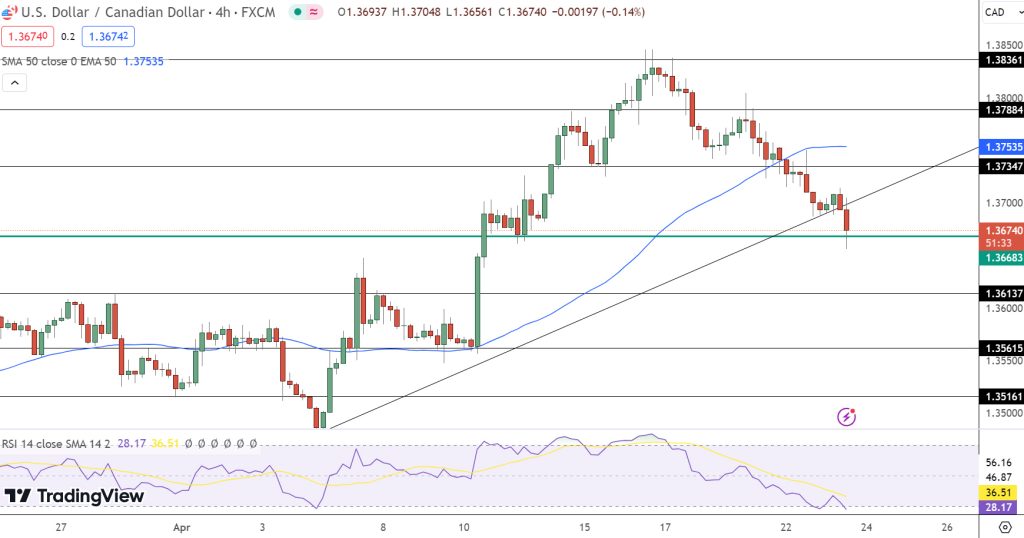
USD/CAD Price Forecast: Technical Outlook
On April 23, the USD/CAD pair closed slightly higher at 1.37023, recording a modest increase of 0.05%. This small rise reflects a cautious optimism among traders as they assess critical technical levels to determine the pair’s next movements.
The pivot point is set at 1.3736, indicating immediate resistance, with another resistance level very close at 1.3735, potentially impeding upward movements.
Further resistance levels are identified at 1.3788 and 1.3836, which could be targets for potential bullish advances. Conversely, support levels are notably lower, with immediate support at 1.3614 and additional support at 1.3562 and 1.3516, suggesting points where the price may stabilize if it falls.
Technical indicators provide deeper insights into the pair’s behavior. The Relative Strength Index (RSI) is at 33, suggesting the pair is approaching oversold conditions that might precede a rally if buyers engage at these crucial support levels.
Meanwhile, the 50-day Exponential Moving Average (EMA) stands at 1.3753, above the current price, indicating a bearish trend in the medium term that might be stabilizing.
- Check out our free forex signals
- Follow the top economic events on FX Leaders economic calendar
- Trade better, discover more Forex Trading Strategies
- Open a FREE Trading Account
- Read our latest reviews on: Avatrade, Exness, HFM and XM
Related Articles


Sidebar rates
Related Posts
