Forex Signals Brief April 26: BOJ Over, US PCE Inflation Will Close the Week
Today everyone is waiting for the PCE price index inflation which might set the trend for next week.

Yesterday the economic calendar was empty during the Asian and European sessions, but it kicked off in the US session with the US Q1 GDP report, GDP price index and unemployment claims. The market reacted negatively to Q1 advance GDP growth falling short of expectations, coming in at 1.6% instead of the anticipated 2.4%.

However, the GDP price index for the quarter exceeded predictions, registering at 3.7% compared to the forecasted 3.4%. These outcomes heightened market concerns, particularly ahead of the release of the monthly core PCE data tomorrow. There are indications that the month-to-month core PCE could rise closer to 0.5%, surpassing the 0.3% forecast.
If realized, this could lead to a higher year-over-year figure, possibly exceeding the anticipated 2.7%. The combination of lower growth and increasing inflation had a negative impact on markets. Stock prices declined, bond yields rose, and the US dollar strengthened. Yields across the curve reached their highest levels, with the 2-year yield surpassing 5%.
Today’s Market Expectations
Today started with the Tokyo CPI inflation ahead of the BOJ meeting. Last night’s CPI data for Tokyo, Japan, indicates a notable decline in inflation, marking the first reading below the target since September 2022. This outcome may not align with the Bank of Japan’s expectations, as inflation has decreased rapidly. As a result, there wasn’t a compelling reason for the Bank of Japan to adopt a hawkish stance in response to this development.
Tokyo’s April CPI, excluding fresh food, increased by 1.6% year-on-year, falling short of the expected 2.2% rise. The previous reading was +2.4% year-on-year. The overall Tokyo CPI for April stood at 1.8%, down from the previous reading of 2.6%. However USD/JPY ignored the report, awaiting the BOJ.
Today’s highlight is the release of US core PCE inflation data later in the US session. The PCE year-on-year (Y/Y) is anticipated to reach 2.6%, a slight increase from the previous year’s 2.5%, while the month-on-month (M/M) metric is expected to remain stable at 0.3%. The Core PCE Y/Y, which is the Federal Reserve’s preferred measure of inflation, is forecasted to be 2.7%, a decrease from the previous year’s 2.8%, with the M/M figure expected to be 0.27%.
Yesterday the volatility was low again as traders await the US PCE inflation report. However, there was a 50 pip wobble after the release of the US Q1 GDP figures. As a result, we opened just one trading signal, selling Gold as the buying pressure has abated for now, leaving it trading in a range.
Selling Gold at the Top of the Range
Gold reversed lower last week after surging all this year, and retreated below $2,300 on Friday. It eventually returned above this level but hasn’t shown any bullish attempts throughout this week. It has been trading in a range in fact, being enveloped by two moving averages. We decided to open a sell Gold signal at the 100 SMA (green) yesterday.
XAU/USD – 60 minute chart
Expecting BOJ Intervention Anytime, After USD/JPY Breaches 1.55
The USD/JPY exchange rate has finally breached the 155.00 level after trading below it for two weeks, supported by strong US durable goods orders in March. This breakout indicates heightened volatility and raises the possibility of intervention by the Ministry of Finance (MOF). However, the underlying strength of the USD, driven by fundamentals, may ultimately outweigh MOF interventions in the long term.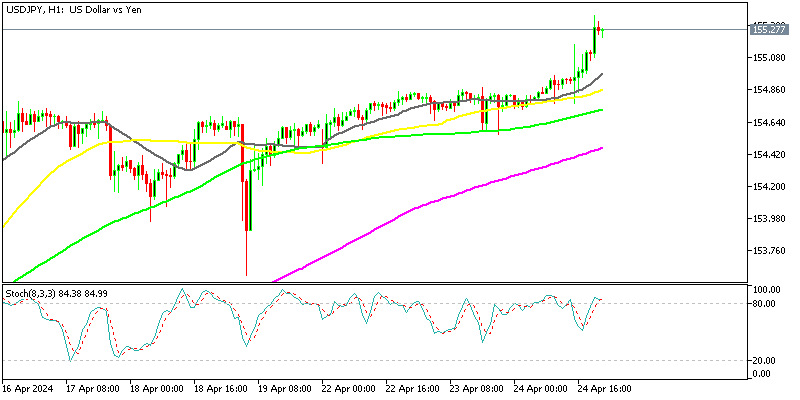
USD/JPY – Daily Chart
Cryptocurrency Update
Bitcoin Not Continuing the Decline
Bitcoin has dipped below the $60,000 mark, hitting its lowest level since early March. Currently hovering around $61,200, it’s in proximity to its recent low of about $59,300, observed approximately a month ago. Despite expectations of further declines if this level was breached, Bitcoin found support in this range and managed to rebound above $67,000. However, the 50-day Simple Moving Average (SMA) turned into resistance, and a bearish reversal occurred yesterday following a doji candlestick pattern.
BTC/USD – Daily chart
Ethereum Holds Above $3,000
ETHEREUM experienced a decline last week, dropping below the $3,000 mark and breaching the 100-day Simple Moving Average (SMA) on the daily chart. However, it managed to reclaim ground above $3,000. Although buyers made significant gains yesterday, the upward momentum halted near the 20-day SMA (grey) and reversed direction downward.
ETH/USD – Daily chart
- Check out our free forex signals
- Follow the top economic events on FX Leaders economic calendar
- Trade better, discover more Forex Trading Strategies
- Open a FREE Trading Account
- Read our latest reviews on: Avatrade, Exness, HFM and XM
Related Articles


Sidebar rates
Related Posts
