S&P 500, Dow, Dax, Nasdaq Close Week Up as Stocks Resume Uptrend
Stock markets returned higher at the end of the week, with all major indices like S&P 500, Dow Jones, Nasdaq, Dax 30 all making solid gains.
Stock markets returned higher at the end of the week, with all major indices like S&P 500, Dow Jones, Nasdaq, Dax 30 all making solid gains. After the bullish reversal in the first half of the week, there was a dip on Thursday, which put into question the bullish reversal, but the gains on Friday confirmed that the retreat we saw earlier this month is over.
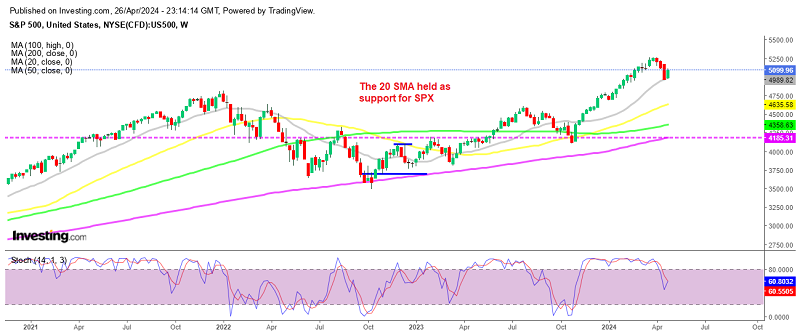
S&P 500 Chart Weekly – Bouncing Off the 20 SMA
Stocks surged yesterday as investors digested strong earnings reports from Alphabet, Microsoft and other companies, along with the latest inflation data. The market rally was fueled by the positive tech results, which overshadowed worries about persistent inflation. The S&P 500 index jumped 2.7%, after falling since the first week of April. Last week the decline picked up pace, but the decline stopped right at the 20 SMA (gray) on the weekly chart and the price bounced higher today.
The release of the core PCE statistics by the Federal Reserve acted as the catalyst for market movement on Friday. The core PCE metric is the Fed’s preferred measure of inflation. Concerns had arisen following the Q1 GDP report, which showed core PCE data surpassing forecasts in the first quarter, leading to apprehension about a potential positive surprise in Friday’s release. However, the month-on-month (MoM) figure ultimately matched expectations at 0.3%. There were speculations prior to the release suggesting the possibility of a higher range, between +0.4% and +0.5%, based on the GDP price index results.
Nasdaq Chart Weekly – Gaining More than 4% This Week

The NASDAQ index also showed significant strength this week, gaining around 325 points or 2.1% on Friday which is the biggest daily gain in two months. Looking at the performance for the training week, the NASDAQ is up by 4.20%, making it the best weekly increase this year and the highest since October last year.
From a technical perspective, the price is trading above the 20-day moving average, which is at 17,200-300. This zone prompted buyers to jump in at the beginning of the week, as it used to be resistance at the end of 2024, now turning into support.
S&P 500 Live Chart
- Check out our free forex signals
- Follow the top economic events on FX Leaders economic calendar
- Trade better, discover more Forex Trading Strategies
- Open a FREE Trading Account
- Read our latest reviews on: Avatrade, Exness, HFM and XM
Related Articles


Sidebar rates
Related Posts
