Bitcoin Under Intense Selling Pressure: Will BTC Break Below This $3,000 Range?
Bitcoin is fast dumping at press time. As things stand, BTC prices may breach the psychological level at $60,000
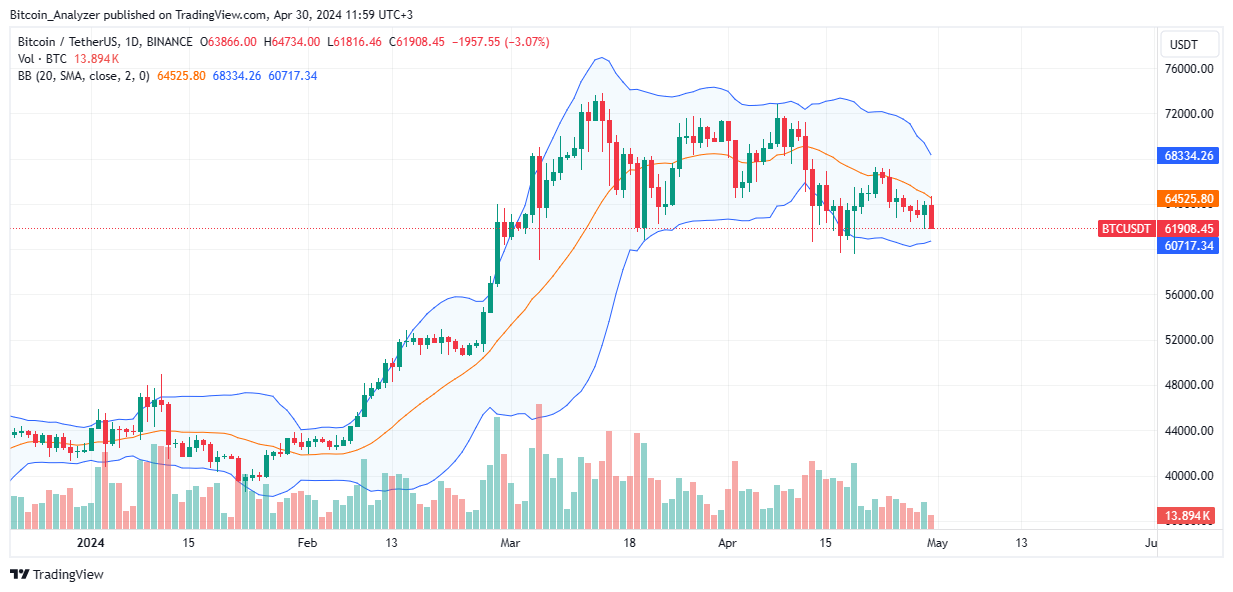
Bitcoin has been moving horizontally, inside a defined range, for the past four trading days. Even though the bulls are optimistic, bears seem to have the upper hand, looking at the formation in the daily chart. Unless there are sharp gains above $68,000, pumped by rising volumes, bears might push lower, even breaking below $61,000 support in the coming sessions. Thus far, traders are cautiously optimistic, expecting fundamental events to drive price action.
Presently, prices are stable, moving inside a $3,000 zone. From coin trackers, BTC is down 5% in the previous trading week. At the same time, the average trading volume is at $25 billion but up 20% in the last day. Since prices are consolidating, participation will likely be relatively low unless there is a conclusive breakout in either direction.
The following Bitcoin news events will shape price action:
- Even as crypto critics claim Halving would make mining more centralized and a hub for farms, the network continues to function as intended. Yesterday, a solo miner mined a block, receiving all the fees and rewards.
- The Australian Securities Exchange (ASX) is moving towards approving a spot Bitcoin ETF by the end of the year. This trend follows the approval of a similar product by the United States SEC in January 2024.
Bitcoin Price Analysis
BTC/USD is under immense selling pressure, looking at events in the daily chart.
As prices consolidate within a narrow range, sellers seem to take charge.
With the dump in the early London session, price action favors sellers.
However, risk-averse traders should stay put unless there is a break below this range at $60,000.
Losses below $60,000 might trigger more losses aligning with the bar of April 13. In this case, the immediate target will be $53,000.
Any upswing above $65,000 may be the basis of more gains towards $70,000.
- Check out our free forex signals
- Follow the top economic events on FX Leaders economic calendar
- Trade better, discover more Forex Trading Strategies
- Open a FREE Trading Account
- Read our latest reviews on: Avatrade, Exness, HFM and XM
Related Articles


Sidebar rates
Related Posts
