Forex Signals Brief Apr 30: EU CPI and US Employment Cost Index
Yesterday was all about the yen, while today traders are looking at the Eurozone CPI and US Employment Cost Index

Yesterday the focus was primarily on the JPY, following what appears to be an intervention by Japanese authorities such as the Ministry of Finance (MoF). The evidence was a 600-pip crash after the USD/JPY pair broke above the 160.00 level. As North American traders entered the market, the rise slowed and stabilized slightly below 157.00 after falling below 155 briefly.

Apart from the yen, the US dollar exhibited weakness as Treasury yields declined. The euro and GBP made modest gains against the weakening dollar. Temporary reductions in Treasury borrowing estimates initially lowered yields, but the market ultimately interpreted it as a timing and cash balance issue.
Some of the dollar’s decline may be attributed to position squaring ahead of a heavy week of economic data. Commodity currencies generally performed well, with the NZD and AUD outperforming the Canadian dollar as oil prices fell. Talk of further rate hikes is contributing to pushing the Australian dollar towards the 0.6000 level.
Today’s Market Expectations
Today started with the Unemployment Rate from Japan. The unemployment rate for March 2024 remained unchanged at 2.6%, higher than the expected 2.5%. The job/applicant ratio for the same period was 1.28, surpassing expectations of 1.26 and indicating a favorable job market. Preliminary industrial production for March showed a month-on-month increase of 3.8%, beating expectations of 3.3%. However, year-on-year industrial production saw a decline of 6.7%, slightly worse than the expected 6.6%. In terms of retail sales, March 2024 saw a month-on-month decrease of 1.2%, below the anticipated -0.6%. Year-on-year retail sales growth stood at 1.2%, falling short of the expected +2.4% and reflecting a slowdown compared to the previous year’s figure of +4.7%.
The Eurozone Consumer Price Index (CPI) year-on-year (Y/Y) is forecasted to be 2.4%, matching the figure from the previous year. Meanwhile, the Core CPI Y/Y is anticipated to be 2.6%, down from 2.9% previously. The European Central Bank (ECB) has already indicated its intention to implement a rate cut in June, and it would likely require two consecutive robust reports and poor Q1 2024 wage growth statistics to dissuade them from this plan. The market anticipates three rate cuts this year, and although this week’s announcement is unlikely to directly impact the probability of a June move, it could influence market pricing for the rest of the year.
The US first-quarter Employment Cost Index (ECI) is expected to be 1.0%, up from 0.9% in the previous quarter. This index is regarded as the most comprehensive measure of labor expenses, although it is not as up-to-date as Average Hourly Earnings statistics. Nevertheless, the Federal Reserve closely monitors this signal. Wage growth has slowed over the past two years, but it remains relatively high. If the data comes in strong, it is likely to prompt a hawkish reaction from the market, considering the recent shift in tone from the Fed. This is because even if it doesn’t lead to a second wave of inflation, increasing wage growth coupled with a tight labor market can sustain higher inflation levels for longer periods. This could pose a risk of expectations becoming unanchored and make it challenging to return to the Fed’s target on a sustainable basis.
US Consumer Confidence is expected to decrease to 104.0 in April from 104.7 in March. The Chief Economist of the Conference Board pointed out that confidence has been relatively stable over the past six months, with no clear upward or downward trend observed across different income or age groups. Additionally, while consumers remain worried about high prices, overall complaints are on the decline. Concerns about a recession have also been decreasing, and perceptions of the current economic situation improved in March, primarily due to more positive views of the current job market.
Yesterday the volatility returned in the markets particularly in the JPY pairs, with some enormous moves in both directions. We opened four forex signals in total, ending the day with two winning trading signals and two losing ones.
Gold Continues to Trade Between 2 MAs
GOLD is currently stabilizing within the range of $2,310 to $2,350 as traders await the FOMC meeting on Wednesday. After experiencing a cooling off period last week due to high demand, gold has been consolidating for the past two weeks, with buyers successfully maintaining prices within this range. On the chart, gold’s price is situated between the 200-hour Moving Average (MA) at the top (marked in purple) and the 50 Simple Moving Average (SMA) (yellow line) below. Additionally, the 100-hour MA (green line) has recently acted as support near the bottom. This suggests a more neutral near-term outlook for Gold.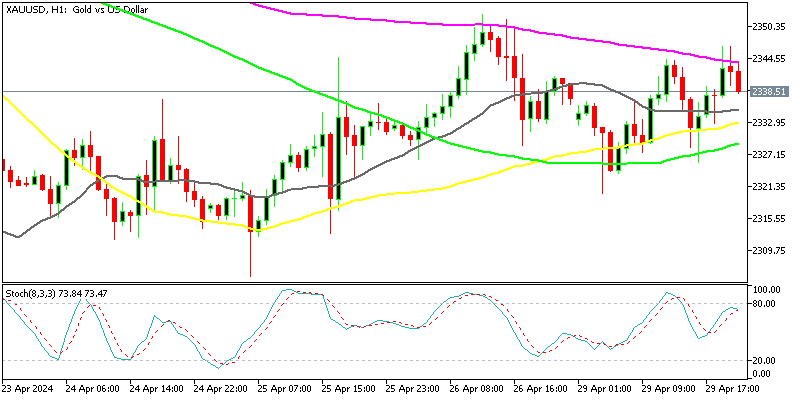
XAU/USD – 60 minute chart
USD/JPY Keeps Bullish Despite the Intervention
USD/JPY surged above 160 early on Wednesday, but the Bank of Japan (BOJ) intervened, resulting in a total decline of 600 pips. Despite a subsequent 300-pip rally, the price dropped once more, highlighting the extreme volatility of this currency pair. USD/JPY fell from 160.22 to 154.53 several hours later. However, the 50 Simple Moving Average (SMA) (yellow line) on the H4 chart prevented further decline and pushed the price back up. Therefore, the BOJ’s intervention appears to be merely buying time.
EUR/USD – Daily Chart
Cryptocurrency Update
Bitcoin Keeps Making Lower Highs
Bitcoin has dropped below $65,000 after bouncing back from a low of $60,000. Currently, BTC is hovering around $62,200, with buyers unable to push the price above the 50 Simple Moving Average (SMA) (yellow line). This moving average has transformed into resistance, leading BTC to form a lower high, signaling a retreat. However, there is considerable support at $60,000, where we plan to buy Bitcoin again.
BTC/USD – Daily chart
Ethereum Stuck Between 2 MAs
Last week, Ethereum dropped below $3,000, breaching the 100-day Simple Moving Average (SMA) on the daily chart. However, it managed to recover and rose back above $3,000. Despite significant gains made by buyers, the upward momentum faltered around the 50-day SMA (yellow line) and reversed lower. However, the 100 SMA (green) is acting as support at the bottom, keeping ETH confined in a tight rage.
ETH/USD – Daily chart
- Check out our free forex signals
- Follow the top economic events on FX Leaders economic calendar
- Trade better, discover more Forex Trading Strategies
- Open a FREE Trading Account
- Read our latest reviews on: Avatrade, Exness, HFM and XM
Related Articles


Sidebar rates
Related Posts
