Forex Signals Brief May 1: Will the FED Reject A September Cut?
Today everyone is awaiting for the FED to give some direction about interest rates, but before that we have the US JOLTS job openings

In the US session yesterday, markets turned their attention to the US dollar ahead of today’s FOMC meeting, largely due to a robust employment cost index. There’s concern that the Fed might hint at potential rate hikes. While changes in the European session were minimal, the dollar surged following the data release and maintained its strength.

The initial impact of the Employment Cost Index numbers in changes was around 30-40 pips, but this grew over the day up to 100 pips in some forex pairs, fueled by continuous selling in bond and equity markets. Additionally, the Canadian dollar faced pressure from weaker GDP figures and declining oil prices, with February’s GDP missing estimates of 0.3%, coming at 0.2% and January’s GDP revised downward to 0.5% from 0.6%.
Today’s Market Expectations
Today started with the New Zealand employment report released this morning, which showed significant weakness. The unemployment rate rose to 4.3%, exceeding expectations of 4.2%, compared to the Q4 unemployment rate of 4.0%. Employment change was -0.2%, falling short of the expected 0.3%. Previous employment change was 0.4%. The participation rate for Q1 was 71.5%, down from the previous rate of 71.9%. The employment cost index (quarter-on-quarter) was 0.8%, meeting expectations.
The US ISM Manufacturing PMI is expected to slightly decrease to 50.1 from 50.3 previously. Last month marked the first expansion of the index after 16 consecutive months of contraction, receiving mostly positive feedback. However, the latest S&P Global US Manufacturing PMI reverted back into contraction territory after the Q1 2024 expansion. Recent discussions have been quite pessimistic, with reports of significant layoff activity, although there have been some positive developments regarding inflation.
JOLTS job openings in the United States will be released at the same time as the ISM manufacturing and are expected to reach 8.680 million, slightly down from 8.756 million previously. Despite being based on March data, this report is anticipated to be the first significant US labor market update of the week and is typically impactful for the market. In the latest report, there was a modest beat, albeit with negative adjustments to previous figures, suggesting a resilient but normalizing employment market. Additionally, attention will be paid to hiring and turnover rates, which have recently dipped below pre-pandemic levels.
The Fed is expected to maintain interest rates at 5.50%, with no significant changes to the statement except for acknowledging the recent setback in the effort to combat disinflation. The focus will be on Fed Chair Powell’s press conference and any updates on the QT taper. Given recent hawkish comments from Fed officials, including Fed Chair Williams suggesting a possible rate hike if inflation growth stalls or reverses, it’s unlikely we’ll see anything new. The market is currently only pricing in one rate cut in 2024, a notable change from earlier in the year when it was pricing in seven.
Yesterday the volatility was low in the European session, but it kicked off after the strong US employment cost index, which gave the USD a 100 pip boost across the board. We opened sever trading signals in total, closing the day with five winning forex signals and two losing ones.
Gold Falls Below $2,300
GOLD prices had been consolidating above $2,300 for several days after retreating from $2,400. Buyers managed to keep prices within a range, with fluctuations between $2,310 and $2,350. However, yesterday, XAU resumed its decline, dropping below $2,300. Calming geopolitical tensions have contributed to an improvement in risk sentiment in financial markets, leading safe-haven assets like Gold, Silver, and the Swiss Franc to turn bearish.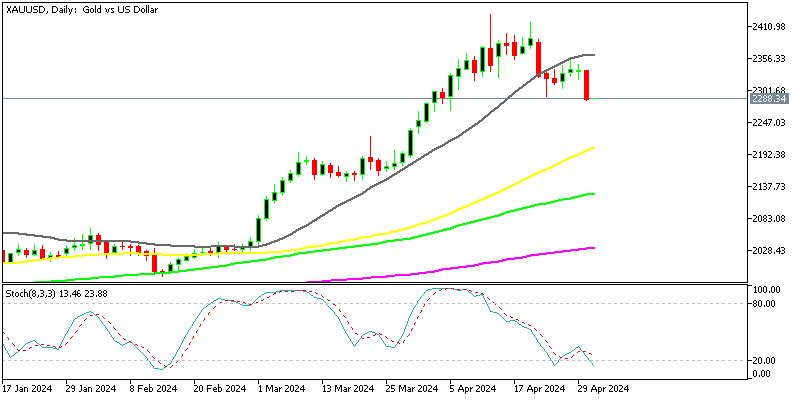
XAU/USD – Daily chart
NZD/USD Heads for Support After Failing at the 20 SMA
NZD/USD witnessed a significant decline, as shown in the H1 chart above. The pair eventually reached a critical support zone around the 0.5860 level. Last week, we observed a retreat in the USD following mixed economic data, although the overall impact was minimal. Nonetheless, any news seems to unsettle the markets lately. However, the ascent halted precisely at the 20-day Simple Moving Average (SMA) (gray), which now appears to be acting as resistance on this chart. Yesterday’s US employment costs/earnings index brought some relief for the USD, indicating an increase in March. This led to a reversal in this pair after facing rejection at the 20 SMA. Subsequently, the New Zealand employment report released this morning was disappointing, further fueling the decline. Consequently, it’s anticipated that this forex pair will drop below the support zone around the 0.5860 level.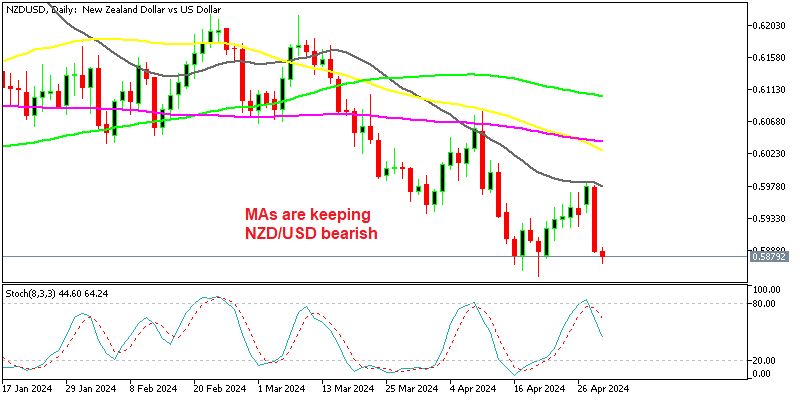
NZD/USD – Daily Chart
Cryptocurrency Update
Buying the Dip in Bitcoin at the 100 Daily SMA
Bitcoin has fallen below $65,000 after rebounding from a low of $60,000. Currently, BTC is hovering around $62,200, with buyers struggling to push the price above the 20 Simple Moving Average (SMA) (gray line). This moving average has now turned into resistance, causing BTC to form a lower high, indicating a potential retreat and a potential break below the $60,000 level. However, there is significant support at $60,000, where we plan to buy Bitcoin again.
BTC/USD – Daily chart
Ethereum Stuck Between 2 MAs
Last week, Ethereum dropped below $3,000, breaching the 100-day Simple Moving Average (SMA) on the daily chart. However, it managed to recover and rose back above $3,000. Despite significant gains made by buyers, the upward momentum faltered around the 50-day SMA (yellow line) and reversed lower. However, the 100 SMA (green) is acting as support at the bottom, keeping ETH confined in a tight rage.
ETH/USD – Daily chart
- Check out our free forex signals
- Follow the top economic events on FX Leaders economic calendar
- Trade better, discover more Forex Trading Strategies
- Open a FREE Trading Account
- Read our latest reviews on: Avatrade, Exness, HFM and XM
Related Articles


Sidebar rates
Related Posts
