S&P 500 Closes at the Highs, As Apple Earnings Beat Forecasts
The major stock indices are shrugging off earlier reports and the S&P index closed at the highs, while Apple earnings showed were impressive
The major stock indices are shrugging off earlier reports and the S&P index closed at the highs, while Apple earnings showed good performance. Numbers showed reduced productivity and increased unit labor costs which should have been bullish for the USD, however, markets are released that the FED is not thinking about raising interest rates again.
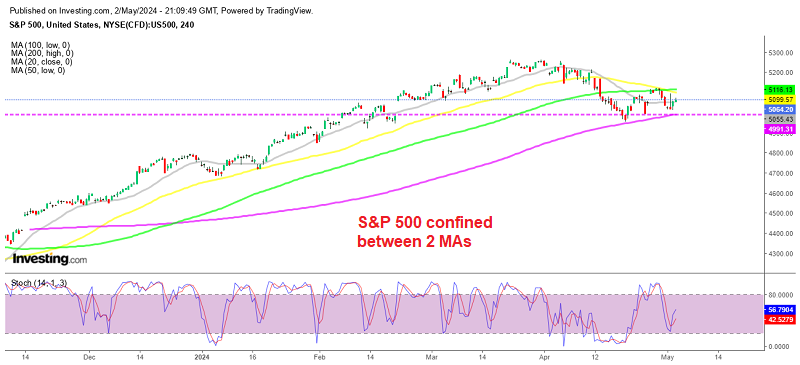
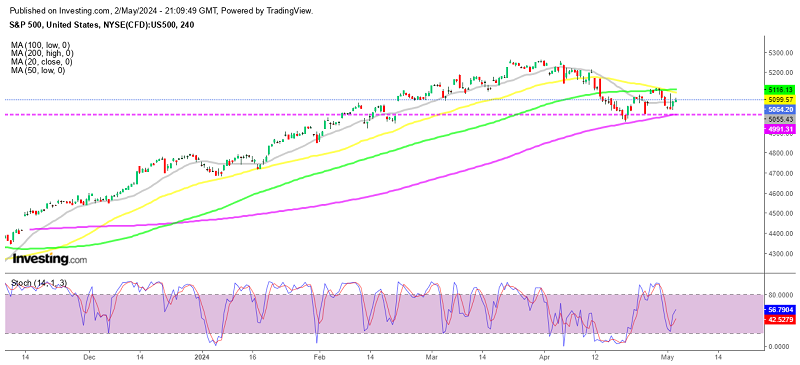
S&P 500 Chart H4 – Trading Between 2 MAs
Unit labor costs rose by 4.7%, surpassing the expected 3.3% increase by a significant margin. However, the previous quarter’s rate was revised down to 0.0%, which is positive news. Productivity declined to 0.3%, compared to the predicted 0.8%. However, the productivity growth rate for Q4 was revised upward to 3.5% from 3.2%. After the market closed, Apple released their quarterly earnings report, which was positive.
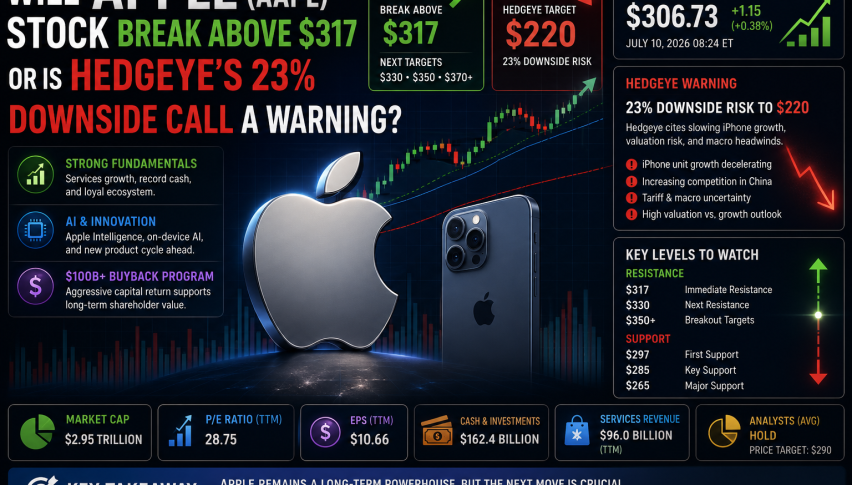
Apple’s earnings per share (EPS) were positive as well, which is helping the sentiment, as they came in at $1.53, beating the expected $1.50. Revenues were $90.75 billion, exceeding the expected $90.01 billion. Additionally, Apple announced an additional $110 billion of share buybacks, a record amount, and increased their quarterly dividend. As a result, Apple’s shares are up $2.02 or 1.15% at $171.32.
Weekly US Initial and Continuing Jobless Claims on May 2, 2024
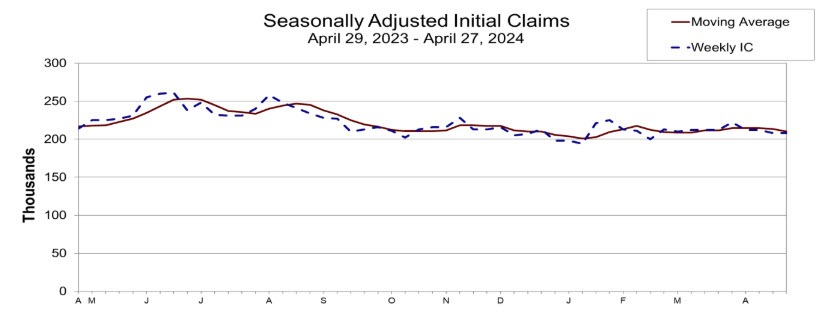
- US initial jobless claims 208K versus 212K estimate
- Prior week 207K revised to 208K.
- Initial jobless claims 208K versus 212K estimate.
- 4-week moving average of initial jobless claims 210K vs 213.5K last week.
- Continuing claims 1.774M versus 1.797M estimate.
- 4-week moving average of continuing claims 1.789M vs 1.793M last week.
The weekly US initial jobless claims were reported at 208,000, slightly below the estimated 212,000. The previous week’s figure of 207,000 was revised upward to 208,000. The 4-week moving average of initial jobless claims stood at 210,000, compared to 213,500 the week before. Continuing claims totaled 1.774 million, lower than the estimated 1.797 million. The 4-week moving average of continuing claims was 1.789 million, down from 1.793 million the previous week.
As time goes on, initial jobless claims remain stable. However, the job market continues to be strong. The Federal Reserve chair suggested that an increase in unemployment would be a factor to consider for potential policy easing down the line.
Currently, the price stands at $5054.25, up 36 points from the previous level. The day’s high reached 5058.01. This places the price approximately in the middle of significant daily moving averages. The subsequent corrective high reached 5124. There’s a divide in the market sentiment, with some feeling more optimistic while others are more pessimistic. This split in sentiment is understandable given the uncertainties surrounding the Federal Reserve, the economy, inflation trends, growth prospects, geopolitical tensions, and the upcoming US election.
S&P 500 Live Chart
- Check out our free forex signals
- Follow the top economic events on FX Leaders economic calendar
- Trade better, discover more Forex Trading Strategies
- Open a FREE Trading Account
- Read our latest reviews on: Avatrade, Exness, HFM and XM
Related Articles


Sidebar rates
Related Posts
