Shiba Inu Predicted to Surge 125%: Timing the Rally
Shiba Inu (SHIB) experienced a significant surge in the first quarter of 2024, climbing about 280% between January and March.

Shiba Inu (SHIB) experienced a significant surge in the first quarter of 2024, climbing about 280% between January and March. This increase coincided with the Bitcoin halving event, which propelled Bitcoin to a new all-time high of $73,737.
However, following these gains, SHIB saw a substantial decline through April and May, and is currently trading at approximately $0.00002213, reflecting a 2% drop for the day.
Despite this downturn, the current lower prices may present a buying opportunity for investors anticipating the next upward movement. A well-regarded forecasting agency predicts that SHIB could rally by another 125% in the coming months.
Shiba Inu Price to Soar: Expert Panel Forecasts 125% Rise
Experts from Finder, a cryptocurrency analysis panel, are optimistic about Shiba Inu’s price trajectory, projecting a potential increase of 125% in the near future. According to their revised forecast, SHIB could reach $0.00004930 by 2025.
This projection suggests that a $10,000 investment in SHIB now could potentially escalate to $22,500, offering significant returns within 12 to 18 months. This optimistic scenario positions SHIB for a potential surge similar to Dogecoin’s in 2021, potentially setting up today’s investors for substantial future gains.
Shiba Inu Price Prediction
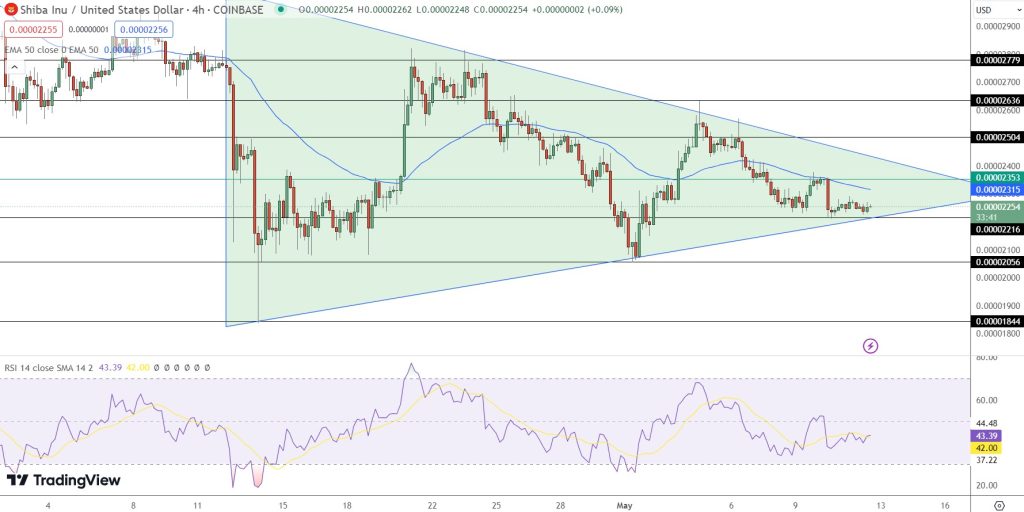
Today, Shiba Inu is trading at $0.00002254, displaying minor fluctuations within a constrained range. The 4-hour chart reveals a pivot point at $0.00002353, serving as the primary gauge for potential price movement shifts.
Key Price Levels:
- Immediate Resistance: $0.00002353
- Next Resistances: Positioned at $0.00002504, $0.00002636, and $0.00002779. These levels mark crucial points where selling pressure might intensify.
- Immediate Support: Just beneath the pivot at $0.00002216
- Further Supports: Found at $0.00002135 and $0.00002056, these zones could potentially cushion any further downtrends.
Technical Indicators:
- RSI: Currently at 42.00, suggesting a lack of strong momentum either way.
- 50 EMA: $0.00002315, slightly below the pivot, indicating near-term resistance.
- 200 EMA: $0.00002200, providing additional support below current levels.
Conclusion: The technical structure suggests a tentative balance between buyers and sellers, with the pivot point being critical. Bullish potential remains above $0.00002353, whereas a drop below this could encourage sellers to target lower supports.
- Check out our free forex signals
- Follow the top economic events on FX Leaders economic calendar
- Trade better, discover more Forex Trading Strategies
- Open a FREE Trading Account
- Read our latest reviews on: Avatrade, Exness, HFM and XM
Related Articles


Sidebar rates
Related Posts
