Silver Price Drops to $29.60 Amid Mixed US Economic Data and CPI Report
Silver (XAG/USD) is currently trading at $29.619, down 0.20%. The 4-hour chart outlines key price levels, starting with a pivot point

Silver (XAG/USD) is currently trading at $29.619, down 0.20%. The 4-hour chart outlines key price levels, starting with a pivot point at $29.84. Immediate resistance levels are at $30.41, $31.05, and $31.75.
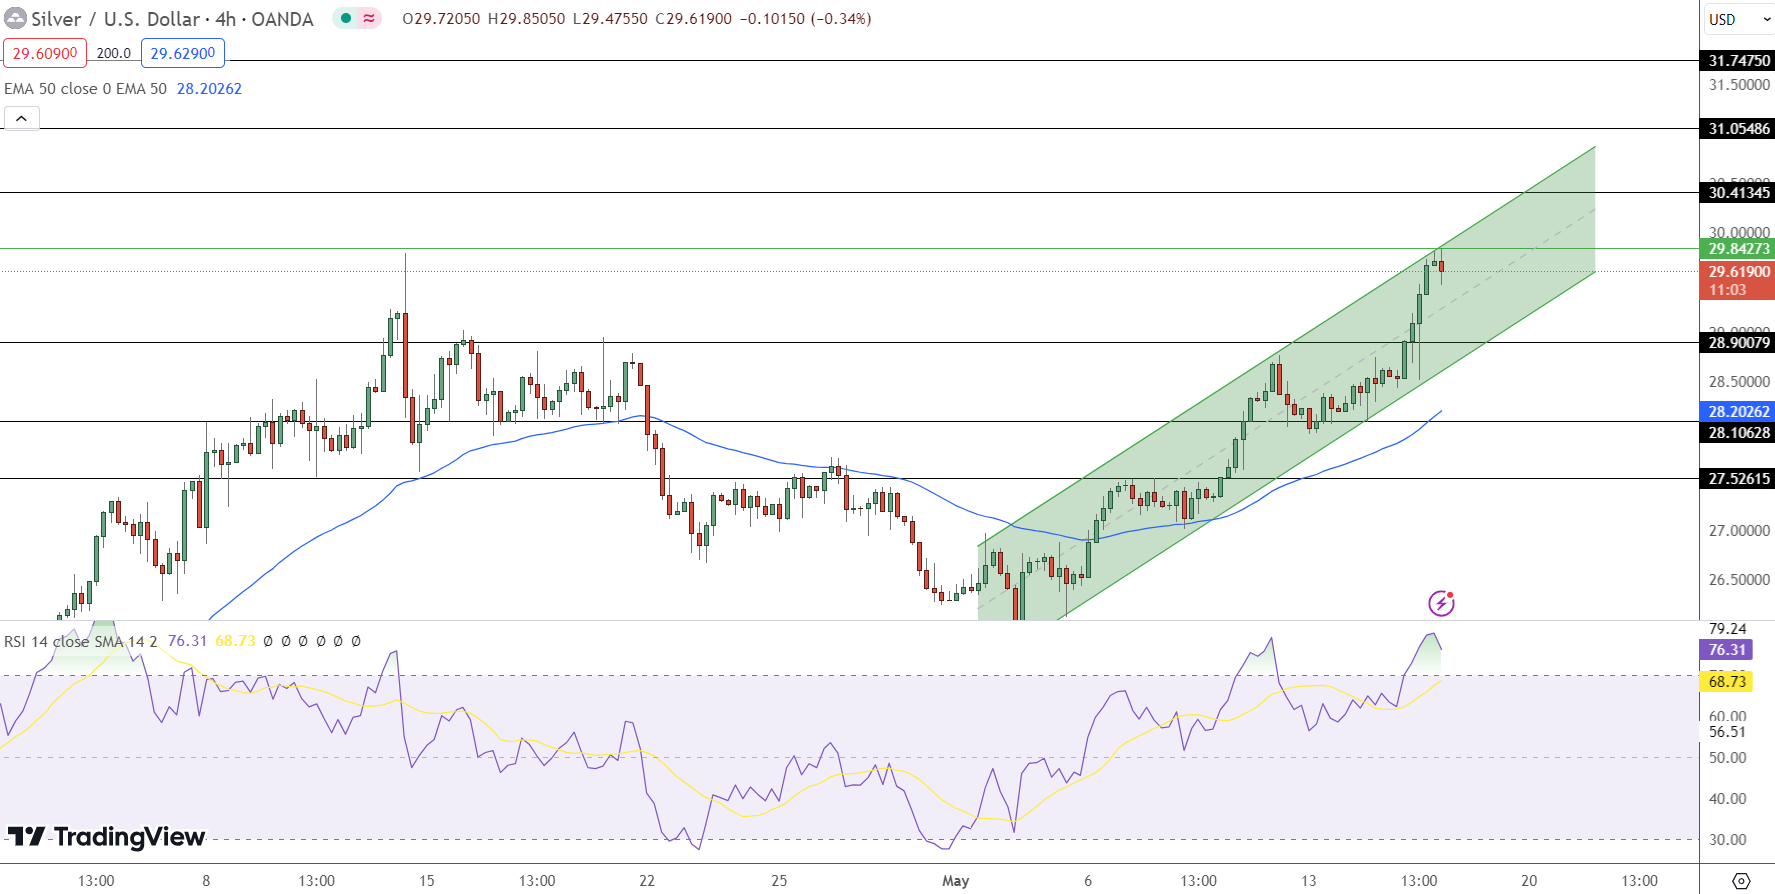
On the support side, immediate levels are at $28.90, $28.11, and $27.53.Technical indicators offer a nuanced picture. The Relative Strength Index (RSI) stands at 76, suggesting overbought conditions that may lead to a potential pullback.
The 50-day Exponential Moving Average (EMA) is positioned at $28.20, with the current price maintaining a bullish stance above this average. The upward channel supports a buying trend; however, the pivot point at $29.84 poses significant resistance.
A bullish breakout above this level could propel silver towards $30.41 or even higher to $31.05.
Fundamental Analysis Impacting Silver Prices
Silver’s recent performance has been influenced by various US economic indicators. The Core CPI month-over-month (m/m) showed a 0.3% increase, aligning with market expectations but down from the previous 0.4%.
Similarly, the CPI m/m rose by 0.3%, also meeting expectations and reflecting a slowdown from the previous month’s 0.4%. On a yearly basis, CPI grew by 3.4%, matching forecasts but slightly lower than the previous 3.5%.
The Core Retail Sales m/m increased by 0.2%, consistent with expectations but significantly lower than the previous 0.9%. The broader Retail Sales m/m remained flat at 0.0%, underperforming the expected 0.4% rise and sharply down from the prior 0.6%.
The Empire State Manufacturing Index showed a decline to -15.6, worse than the expected -9.9 and previous -14.3. This negative sentiment in manufacturing could pressure the US Dollar (USD), potentially benefiting silver prices due to its inverse relationship with the USD.
Conclusion
Silver’s outlook remains bearish below the pivot point at $29.84. However, a break above this level could shift momentum towards a bullish trend, targeting immediate resistance at $30.41 and further levels at $31.05 and $31.75.
- Check out our free forex signals
- Follow the top economic events on FX Leaders economic calendar
- Trade better, discover more Forex Trading Strategies
- Open a FREE Trading Account
- Read our latest reviews on: Avatrade, Exness, HFM and XM
Related Articles


Sidebar rates
Related Posts
