S&P500 (SPX) Price Forecast: Trading at $5,267 Amid Geopolitical Tensions and Fed Concerns
The S&P 500 (SPX) index continued its downward trajectory, remaining pressured around the 5,267 level and hitting an intra-day low of 5,256.

The S&P 500 (SPX) index continued its downward trajectory, remaining pressured around the 5,267 level and hitting an intra-day low of 5,256.
This decline is primarily driven by concerns over Federal Reserve interest rate actions, escalating geopolitical tensions, and uncertainties surrounding US economic data. These factors have influenced investor sentiment, contributing to the index’s bearish performance.
Geopolitical Tensions Escalate, Adding Pressure to S&P 500
Geopolitical tensions in the Middle East and Asia-Pacific region have intensified the bearish pressure on the S&P 500.
The ongoing Israel-Palestine conflict and rising tensions between China and Taiwan, including reports of Chinese fighter jets conducting simulated strikes in the Taiwan Strait, have raised global stability concerns, rattling investor confidence and adding downward pressure on the index.
Strong US Economic Data and Potential Interest Rate Changes Influence S&P 500
Despite the bearish sentiment and geopolitical tensions, strong US economic data has provided some support to the S&P 500. The upbeat figures, including a drop in initial jobless claims and increases in both manufacturing and services PMI, highlight the resilience of the US economy.
However, these positive indicators have also fueled concerns about potential interest rate hikes by the Federal Reserve to curb inflationary pressures. Market expectations are shifting towards the prospect of the Fed maintaining rates, adding to the uncertainty and fluctuations in the S&P 500.
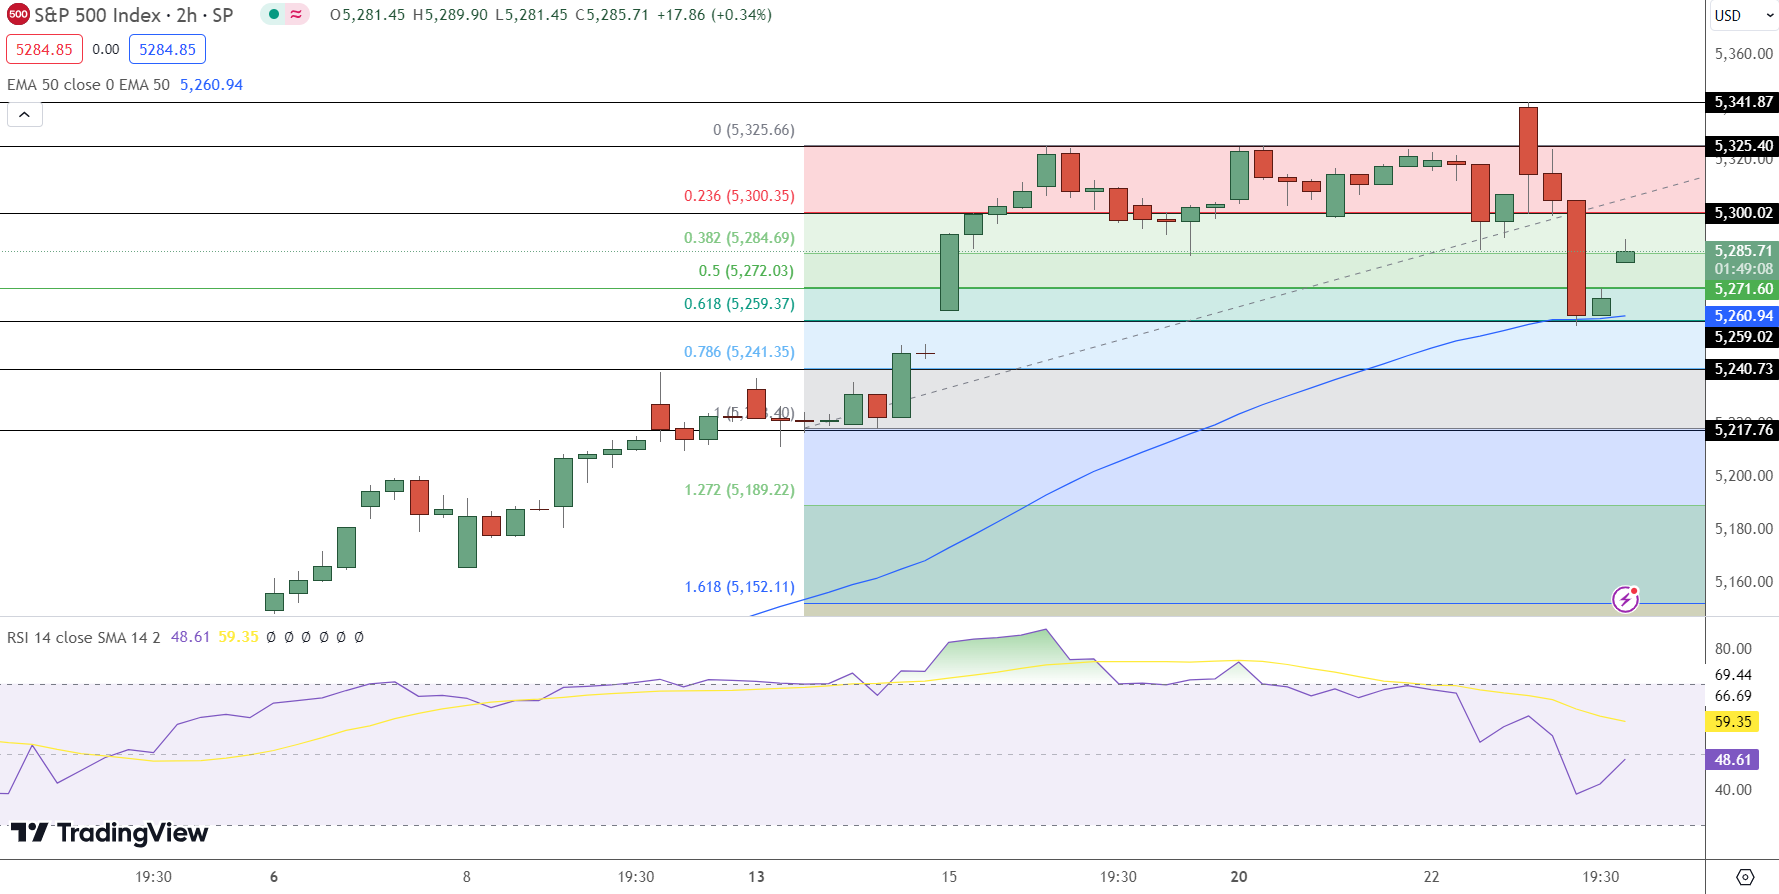
S&P500 Price Forecast – Technical Outlook
The S&P 500 is currently priced at $5,267.85, down 0.74%. The technical outlook presents a cautious picture as the price is trading below the pivot point of $5,297.60.
Immediate resistance is noted at $5,342.04, with further resistance levels at $5,380.93 and $5,419.82. On the support side, the immediate level is at $5,246.67, followed by $5,212.41 and $5,180.58.
The Relative Strength Index (RSI) is at 54, indicating neutral momentum. This suggests that the market could move in either direction depending on upcoming market catalysts.
The 50-day Exponential Moving Average (EMA) is positioned at $5,168.56, providing a significant support level that traders will be closely monitoring.
- Check out our free forex signals
- Follow the top economic events on FX Leaders economic calendar
- Trade better, discover more Forex Trading Strategies
- Open a FREE Trading Account
- Read our latest reviews on: Avatrade, Exness, HFM and XM
Related Articles


Sidebar rates
Related Posts
Ava

