Wait To Trade The Breakout in EURJPY!
Forex crosses remained intact from the Federal Open Market Committee spillover. To be on the safer side, the investors traded forex crosses
Forex crosses remained intact from the Federal Open Market Committee spillover. To be on the safer side, the investors traded forex crosses to avoid unpredictable fluctuations in the market. At the moment, the EURJPY has a good opportunity for us. Are you up for another trade?
EURJPY – Descending Triangle Pattern
The cross currency pair has stuck in the descending triangle pattern which is extending a solid support at $131.275 and resistance at $131.275.
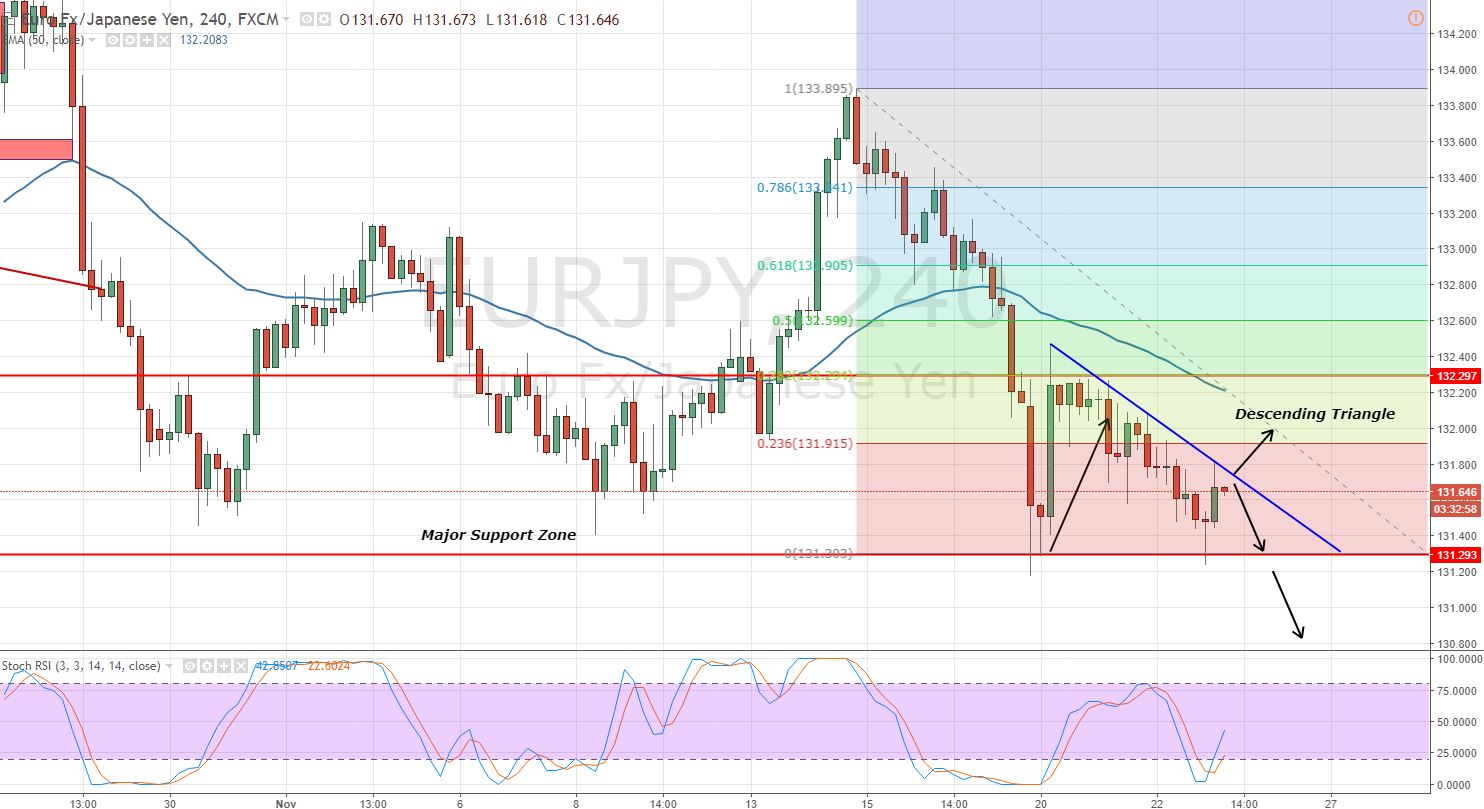
 EURJPY – 4-Hour Chart – Descending Triangle Pattern
 EURJPY – 4-Hour Chart – Descending Triangle Pattern
On the 4-hour chart, the blue line is representing the bearish trendline of the descending triangle pattern. Historically, the descending triangles tend to break downward. Yet, the RSI and Stochastics are diverging with a sell signal.
Support Resistance
131.27 131.89
131.04 132.28
130.65 132.51
Key Trading Level: 131.66
EURJPY – Trading Plan
We have two options:
Sell Limit – Put a sell limit at $132.250 with a stop above $132.450 and a take profit at $131.350.
Sell Stop – Place a sell stop below $131.150 with a stop above $131.450 and a take profit at $130.750.
Good luck!
- Check out our free forex signals
- Follow the top economic events on FX Leaders economic calendar
- Trade better, discover more Forex Trading Strategies
- Open a FREE Trading Account