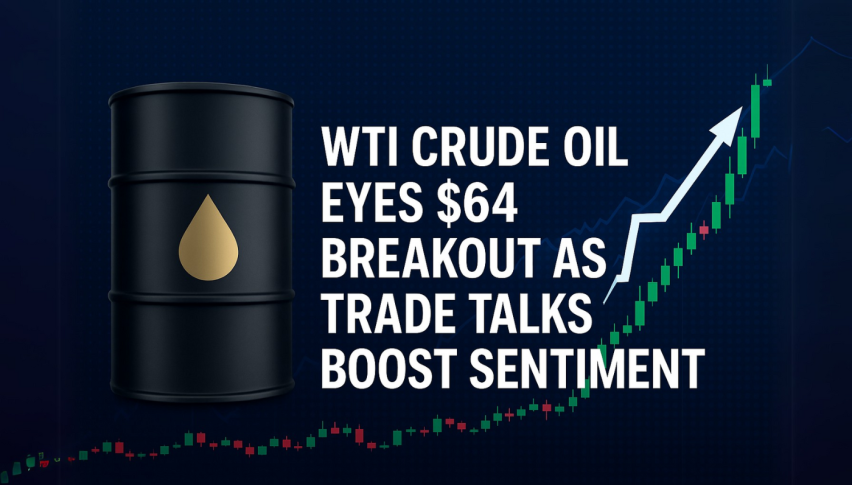
WTI Crude Oil Eyes $64 Breakout as Trade Talks Boost Sentiment
WTI crude oil is up this week trading around $61.57 as optimism over US-China trade talks and demand push prices higher.
Quick overview
- WTI crude oil has increased over 4% this week, trading around $61.57 due to positive US-China trade talks and strong demand.
- US crude inventories have decreased by 1.3 million barrels last week, indicating rising domestic consumption.
- Technical analysis shows immediate resistance at $62.54, with a potential breakout leading to $63.66 if surpassed.
- Traders should be cautious as MACD indicators suggest that bullish momentum may be fading.
WTI crude oil is up this week trading around $61.57 as optimism over US-China trade talks and demand push prices higher. After the big correction in April, prices bounced from $57.73 to retest key support levels. Here’s what’s driving the rally and the levels to watch.
Strong Demand and Trade Optimism
Crude oil is up over 4% this week as US-China trade talks go positive. Over the weekend US officials said a deal to reduce the trade deficit and Chinese Vice Premier He Lifeng confirmed a “big consensus” has been reached. Although details are scarce, this has lifted the market and crude prices as investors expect a trade flow recovery.
US crude inventories have fallen for three weeks in a row, demand is strong. US Energy Information Administration (EIA) said US crude stocks fell 1.3 million barrels last week as domestic consumption picks up.
Key Points:
-
WTI crude up 4% this week
-
US crude inventories fell 1.3 million barrels last week
-
US-China trade optimism boosts demand
Technical Levels to Watch
From a technical standpoint, WTI crude is in an uptrend channel with immediate resistance at $62.54. This level is close to the 50 period exponential moving average (EMA) at $59.81 which has been support in recent sessions. A break above $62.54 could lead to $63.66, a key resistance zone that has capped previous rallies.
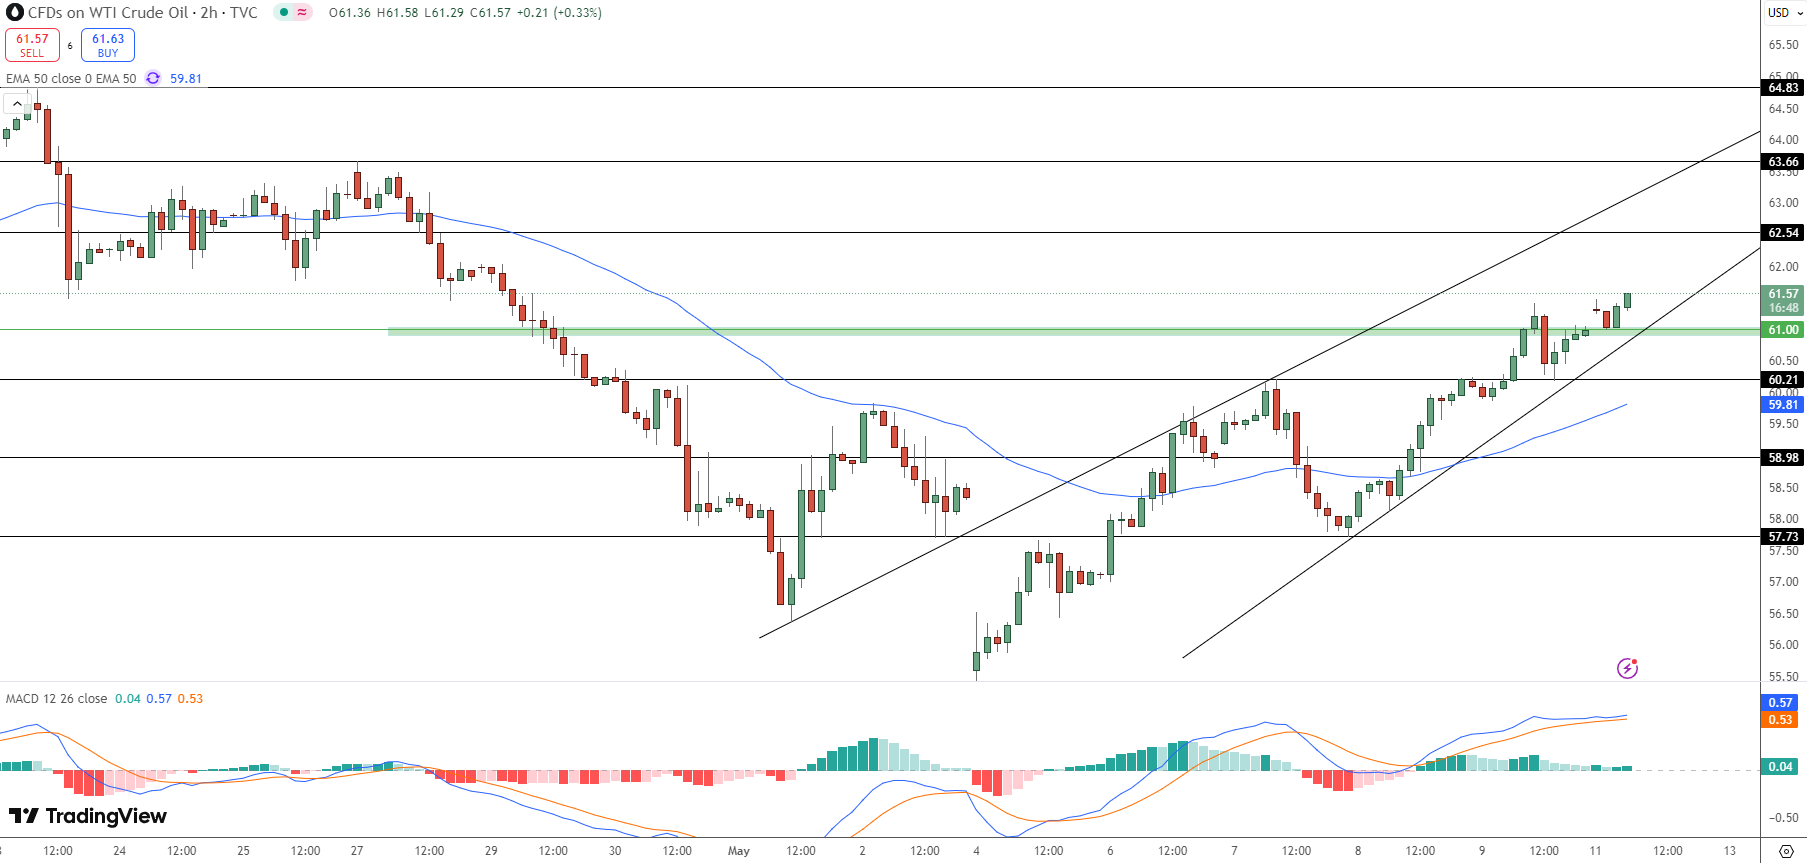
But traders should be cautious as the MACD is showing early signs of slowing down, the histogram is flattening. This could mean bullish momentum is fading and if buyers can’t clear $62.54 we could see a short term pullback.
Key Levels:
-
Immediate Resistance: $62.54
-
Next Resistance: $63.66
-
Immediate Support: $61.00
-
50 EMA Support: $59.81
Conclusion: Breakout?
WTI crude oil is above support but the road higher is tough. A close above $62.54 is needed to confirm the trend, $63.66 and above is possible. Watch for volume and MACD.
- Check out our free forex signals
- Follow the top economic events on FX Leaders economic calendar
- Trade better, discover more Forex Trading Strategies
- Open a FREE Trading Account
- Read our latest reviews on: Avatrade, Exness, HFM and XM
Related Articles
Sidebar rates
