Bitcoin Holds Above $107K: Technical Patterns Signal Potential Rally to $300K Despite Correction Risks
Bitcoin is still holding strong above the important $107,000 milestone, and its price has been pretty constant over the past 24 hours.
Quick overview
- Bitcoin is maintaining its position above $107,000, but market conditions are causing confusion among traders.
- A bullish engulfing pattern has emerged, historically indicating a 78% success rate for upward price movement.
- Elliott Wave analysis suggests Bitcoin could enter a significant Wave 5 rally, potentially reaching values between $300,000 and $425,000.
- However, macroeconomic challenges and declining miner profitability pose risks that could lead to a correction below $100,000.
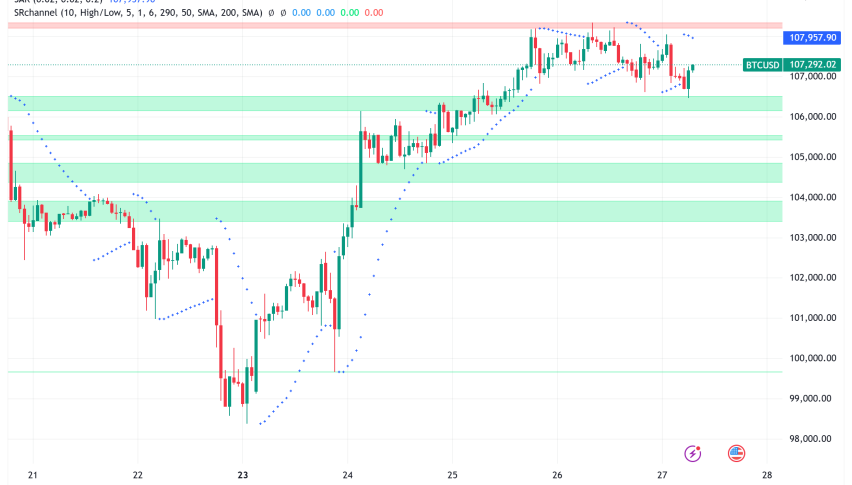
Bitcoin BTC/USD is still holding strong above the important $107,000 milestone, and its price has been pretty constant over the past 24 hours. However, traders and investors have a hard time figuring out what’s going on in the current market because of contradicting technical indications and changing market conditions.
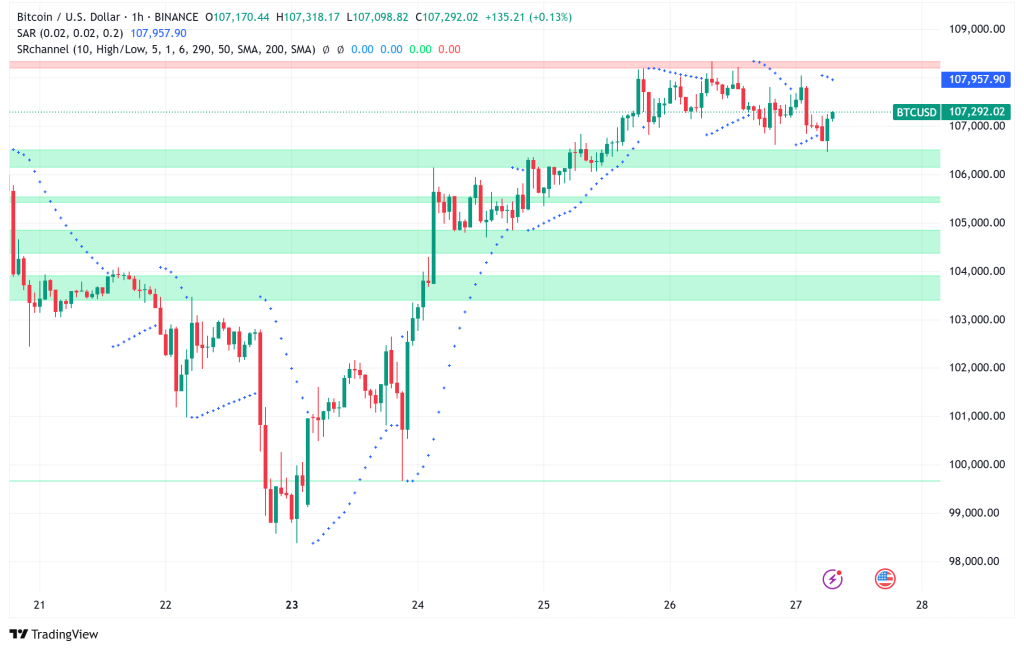
Bullish Engulfing Pattern Shows 78% Historical Success Rate
Bitcoin’s recent price movements have created a strong technical setup that has historically favored upward movement. The cryptocurrency ended the day on Monday with a powerful 4.34% gain, making a bullish engulfing candlestick pattern that entirely reversed two days of price movement that was bearish. This pattern, along with Bitcoin’s ability to stay above $105,000 for several days in a row, implies that the market structure might be changing.
A thorough look at Bitcoin’s bullish engulfing patterns since 2021 shows that they are very reliable. Out of 19 cases that met certain confirmation requirements in a larger bull market, 15 led to new local highs. This means that the method worked 78% of the time. When you look at the pattern in the context of the market trend, it becomes further clearer how well it works. For example, during the bear market of 2022, none of the four identical patterns led to new highs, which shows how important the overall market conditions are.
The current pattern fits all of the validation criteria, such as incorporating at least two preceding candles, appearing at the end of a correction phase, and demonstrating structural fractures after that. With only two failed signals in May 2024 and March 2025, the odds are in favor of the current bull market structure continuing.
Parabolic Structure Points to Extended Wave 5 Rally Above $300K
According to Elliott Wave research, Bitcoin may be approaching the most explosive part of its current cycle. Gert van Lagen, a crypto analyst, says that Bitcoin is stuck in a parabolic step-like growth pattern. The completion of “Base 4” puts the cryptocurrency in a good position for a long Wave 5 breakout.
The study shows how Bitcoin has gone through four different accumulation phases, each of which came before a big breakout. According to Elliott Wave theory, Bitcoin’s current Wave 5, which is the last wave in the five-wave impulsive cycle, may send values up to $425,000, depending on how strong the momentum is and when it happens.
A moving “sell line” that runs under Bitcoin’s price movement is a key part of this prognosis. The longer it takes Bitcoin to achieve this vertical path, the higher the market peak could be because the parabolic trend line curves up. Current predictions say that the market will break out early, by July 7, 2025. However, if the market stays stable through the summer, the expected peak might be even higher.
Liquidity Conditions Echo December 2022 Bottom Formation
Market liquidity indicators are showing signs that haven’t been seen since late 2022, when Bitcoin hit its lowest point at $16,800 and then doubled in three months. Swissblock data shows that current liquidity levels are back to where they were in December 2022, which is a time when there were big bullish continuations in the past.
Bitcoin has taken in more than $544 billion in new capital since its cycle low in November 2022. This has pushed its realized market cap to an all-time high of $944 billion. This huge capital absorption shows that Bitcoin is becoming more mature as a macro asset. Traditionally, liquidity recovery comes before price increases.
Mounting Risks Could Trigger Sub-$100K Correction
Even though the technical patterns are optimistic, there are a number of things that could endanger Bitcoin’s current stability. On Wednesday, the financing rate for perpetual contracts declined to its lowest level in seven weeks. This shows that people are losing faith in leveraged long positions, even though Bitcoin rose to $108,000. This negative financing rate trend shows that traders are becoming more wary about the potential for more upside.
These worries are made worse by macroeconomic challenges. The US started a worldwide trade war in April, and as agreements come to an end, like the eurozone arrangement that ends on July 9, the pressure is back on. Since the current administration assumed office, there have been more than 50 changes to tariff policy, which is making investors even more anxious.
According to CryptoQuant data, Bitcoin miner profitability has dropped to its lowest level in two months, which adds more pressure. Bit Digital’s decision to sell its Bitcoin mining infrastructure and BTC assets in favor of Ethereum has prompted concerns about miners giving up, especially because they are currently under a lot of pressure to make money.
Bitcoin Price Prediction and Market Outlook
Technical analysis shows that Bitcoin has two possible futures. The bullish scenario, backed by the 78% correct engulfing pattern and Elliott Wave forecasts, aims for fresh all-time highs before possibly testing $100,000 again. Extended parabolic structures point to final goals of $300,000 to $425,000 in the present cycle.
But rising macroeconomic uncertainties, falling miner profits, and cautious derivatives mood make it possible for the market to correct itself. While central banks keep interest rates low, which is good for the long term, there is still a chance of short-term drops below $100,000.
- Check out our free forex signals
- Follow the top economic events on FX Leaders economic calendar
- Trade better, discover more Forex Trading Strategies
- Open a FREE Trading Account
- Read our latest reviews on: Avatrade, Exness, HFM and XM
Related Articles

Sidebar rates
Related Posts
