Gold Price Bounces from $3,245 as Dollar Slips – Can Bulls Push to $3,393 Next?
Gold (XAU/USD) climbed back to $3,285 on Monday, bouncing off a one-month low of $3,245 as the U.S. dollar softened.

Quick overview
- Gold (XAU/USD) rebounded to $3,285 after hitting a one-month low of $3,245, aided by a dip in the U.S. dollar.
- Positive global trade developments, including a resolution between the U.S. and China, contributed to easing safe-haven demand.
- Gold remains within a descending channel, with key resistance at $3,349 and support at $3,245, indicating a bearish trend.
- The market is at a crossroads, balancing between relief from geopolitical tensions and hesitation due to lack of momentum for a trend reversal.
Gold (XAU/USD) climbed back to $3,285 on Monday, bouncing off a one-month low of $3,245 as the U.S. dollar softened. A 0.2% dip in the Dollar Index (DXY) gave bullion room to recover, helping gold attract buyers who’d been sidelined by recent strength in the greenback.
The bounce also coincided with positive developments on the global trade front. The U.S. and China resolved a rare earth minerals dispute, and Canada paused its proposed digital tax on American tech companies. These diplomatic moves, along with the continuing Middle East ceasefire, eased safe-haven demand—but they also removed some downside pressure that had been weighing on broader risk sentiment.
“In my experience, these kinds of rebounds—when paired with macro relief and technical support—often signal temporary stabilizations, but not always a full reversal,” I’d note here, especially with $3,250 holding firm for now.
Still, if gold drops below $3,250 again without support, a slide toward $3,200 could quickly follow.
Technical Snapshot: Rebound Within a Downtrend
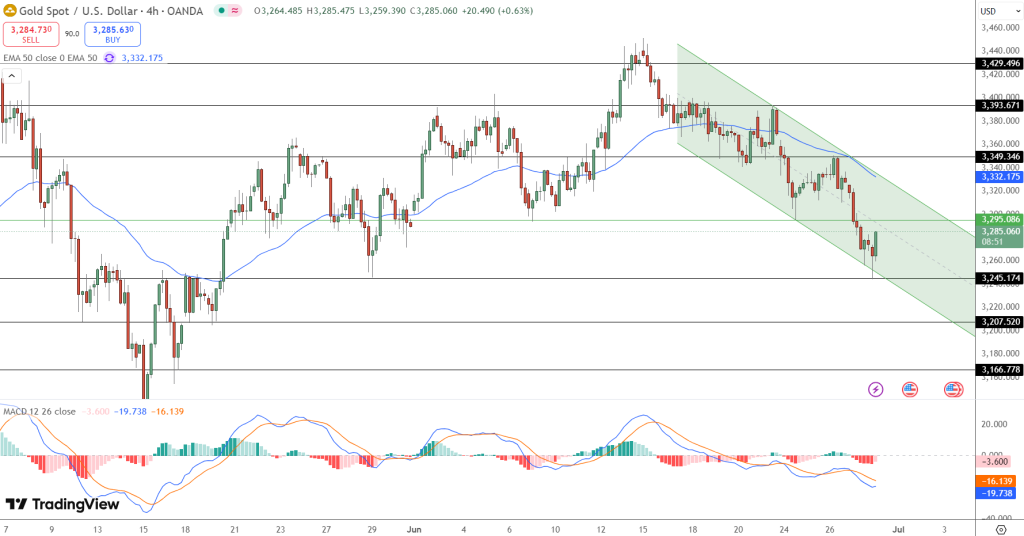
Gold’s bounce looks orderly from a technical standpoint. The metal is still trading within a well-defined descending channel on the 4-hour chart that’s been in place since mid-June. Monday’s low at $3,245 tagged the lower channel boundary almost perfectly—triggering the latest rally.
Yet, price remains under the 50-period EMA ($3,332) and key resistance at $3,349. Unless gold breaks above these levels with conviction, the overall trend bias remains bearish.
Levels to Watch:
- Support: $3,245 → $3,207 → $3,166
- Resistance: $3,332 → $3,349 → $3,393 → $3,429
The MACD histogram is contracting, and signal lines are starting to flatten—early signs of a potential base. But in my view, real confirmation would come only with a clean break above $3,349 and the descending channel.
Outlook: Gold at a Crossroads as Macro Tensions Ease
Gold sits at a critical juncture. With geopolitical tensions easing and the dollar pulling back, the market is balancing between relief and hesitation. There’s support on the chart, but we’re not seeing the type of momentum yet that signals a trend reversal.
- Bullish trigger: A strong close above $3,349
- Next upside targets: $3,393 and $3,429
- Bearish risk: Failure to hold $3,245 could expose $3,207 and lower
Unless bulls take the reins and push price past resistance, this looks like a short-term bounce within a longer-term correction.
In short, gold isn’t breaking down—but it’s not breaking out either.
- Check out our free forex signals
- Follow the top economic events on FX Leaders economic calendar
- Trade better, discover more Forex Trading Strategies
- Open a FREE Trading Account
- Read our latest reviews on: Avatrade, Exness, HFM and XM
Related Articles


Sidebar rates
Related Posts
