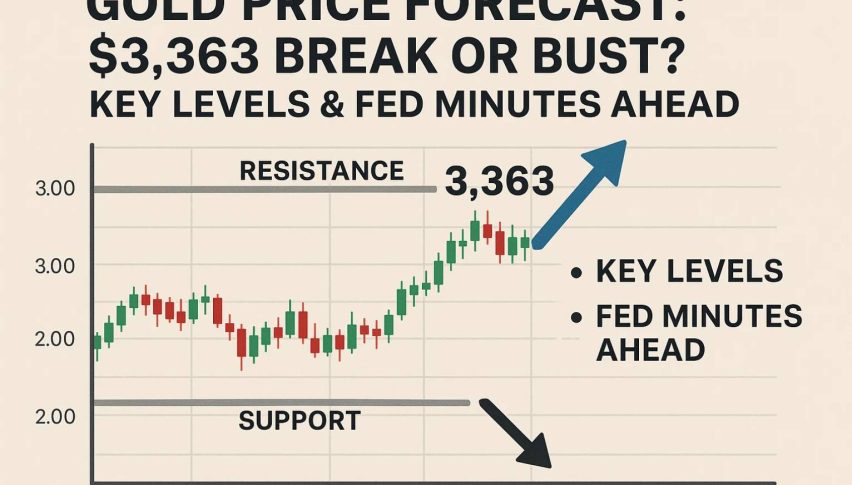
Gold Price Forecast: $3,363 Break or Bust? Key Levels & Fed Minutes Ahead
Gold holds above $3,323 as traders await Fed minutes and data. Will a $3,363 breakout confirm upside momentum or signal a correction ahead?
Quick overview
- Gold (XAU/USD) ended last week flat at $3,336, remaining above a critical support zone as markets awaited key economic reports.
- The upcoming U.S. FOMC meeting minutes and unemployment claims are pivotal events that could influence market expectations for interest rates.
- Despite mixed signals from recent U.S. economic data, easing inflation concerns have kept gold's price action tightly coiled.
- Traders are advised to watch for a breakout above $3,363 or a close below $3,323 to gauge future price movements.
Gold (XAU/USD) ended last week flat, trading near $3,336, as markets digested a string of economic reports and awaited major catalysts ahead. While the U.S. jobs report offered mixed signals, gold’s price action has remained tightly coiled, hovering above a critical support zone at $3,323.
In the week ahead, the spotlight will be on the U.S. FOMC meeting minutes, which are due on Wednesday. At the same time, fresh unemployment claims are due on Thursday.
With U.S. inflation concerns easing slightly and economic data showing signs of a slowdown, gold bulls are watching for any signs of a dovish pivot in the Fed’s tone.
Key Data Recap: Mixed Signals for the Fed
Last week’s U.S. data painted a complicated picture:
- Non-Farm Payrolls: 147K vs. 111K forecast — stronger than expected
- Unemployment Rate: Fell to 4.1% from 4.2%
- ISM Services PMI: Rebounded to 50.8, beating last month’s 49.9
- Factory Orders: Surged 8.2% after a -3.9% dip previously
Even if U.S. labour released solid jobs figures, wage growth slowed to 0.2%, easing inflation fears. This helps explain gold’s tight range, as traders weigh slowing momentum against a still-hawkish Fed.
Looking ahead:
- July 9: FOMC Meeting Minutes
- July 10: Weekly jobless claims and Fed official Waller’s speech
These events could shape market expectations for a possible September rate cut — or delay it altogether.
Gold Technicals: Compression Near Support Zone
Gold’s technical outlook remains neutral-to-bullish, but it is tightly squeezed. Price is stuck between a rising trendline from the June 29 low and resistance at $3,363. Small-bodied candles and spinning tops indicate indecision, while the 50-SMA ($3,323) and 100-SMA ($3,353) act as short-term boundaries.
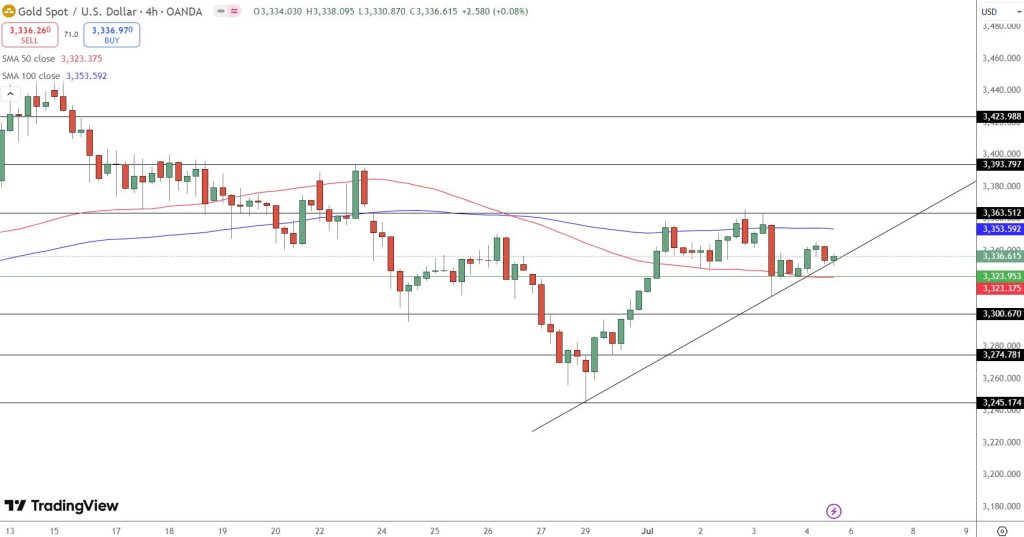
Gold Price Chart – Source: Tradingview
Key Levels to Watch:
- Resistance: $3,363, $3,393, $3,423
- Support: $3,323, $3,300, $3,274
- Trendline: Still rising — a key signal for bullish continuation
A clean break above $3,363 with volume could unlock further upside. On the flip side, a close below $3,323 would expose gold to a pullback toward $3,300 or lower.
Trade Idea: “Compression Break” Setup
Traders watching for a breakout should wait for clear confirmation. The chart suggests gold is nearing a decision point.
- Entry Zone: Above $3,340 with a bullish candle
- Targets: $3,363 → $3,393
- Stop-Loss: Below $3,320
- Bias: Neutral-to-bullish while above trendline
This is a “watch and wait” scenario. If Fed minutes hint at easing policy later this year, gold could reclaim momentum. If not, brace for potential downside.
- Check out our free forex signals
- Follow the top economic events on FX Leaders economic calendar
- Trade better, discover more Forex Trading Strategies
- Open a FREE Trading Account
- Read our latest reviews on: Avatrade, Exness, HFM and XM
Related Articles


Sidebar rates
Related Posts
