Bullish Crude Oil – Stuck In Triangle Pattern!


During the past week, the global financial markets traded the range giving us slightly low trade opportunities than before. Yet, we tried to make sure whatever forex trading signal we share closes at profit. Just like Gold, the Crude Oil is also depending upon the technical analysis today.
WTI Crude Oil came under pressure due to gains in the Buck. As we know, there is a negative correlation between the USD and commodities. Thus, the increased value of the Dollar results in the decrease in demand and ultimately prices of Crude Oil.
Technical Outlook
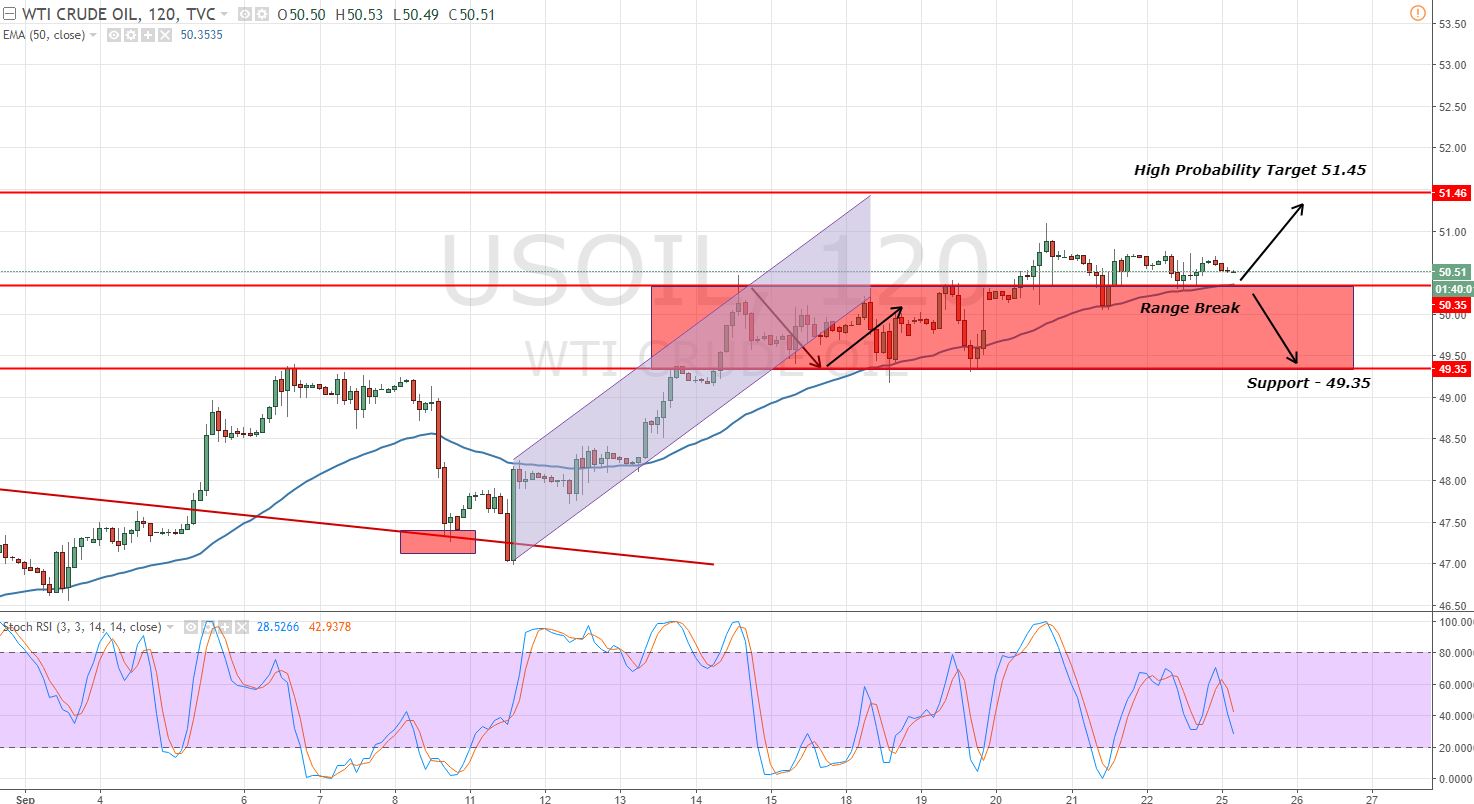
On the 2-hour chart, the Crude Oil has broken above the previously identified trading range of 100 pips ($49.30 – $50.30) but, it hasn't made a lot of bullish moves.
 Crude Oil – 2 Hour – Sideways Market
 Crude Oil – 2 Hour – Sideways Market
 At the moment, Oil is facing a solid support at $50.30. Yup, it's the same level discussed in my previous article on Oil. The Crude Oil pulls back from this level, and we can try buying entry above this until $50.30 support is violated. On the higher side, $51 and $51.45 seems to extend a good resistance. Newbies are highly recommended to check out FX Leaders Support and Resistance trading strategy to gain more grip over the market.
Crude Oil Trading Plan
I'm placing my buy limit at $50.08 with a target of $50.85 and $51 with a stop loss below $49.85. Good luck.