Crude Oil Ready for Retracement – A Potential Trade Idea!


The Crude Oil slumped massively on Friday as U.S. refineries continued to recover from Hurricane Harvey. Sadly, the move was so quick to catch, however, I got a hot setup to trade today. Let's take a look …
Key Technical Drivers
On the 4-hour chart, Oil has formed a spinning top candlesticks pattern followed a sharp bearish move. It's signaling the Crude Oil bears seems to get weaker, and bulls are gaining control in the market. The very next candle is bullish Marubozu which confirms the sentiment placed by spinning top. Check out the FX Leaders Candlesticks Strategy to stay one step ahead of other traders in the market.
 Crude Oil – 4 Hour Chart – Fibonacci Retracement
 Crude Oil – 4 Hour Chart – Fibonacci Retracement
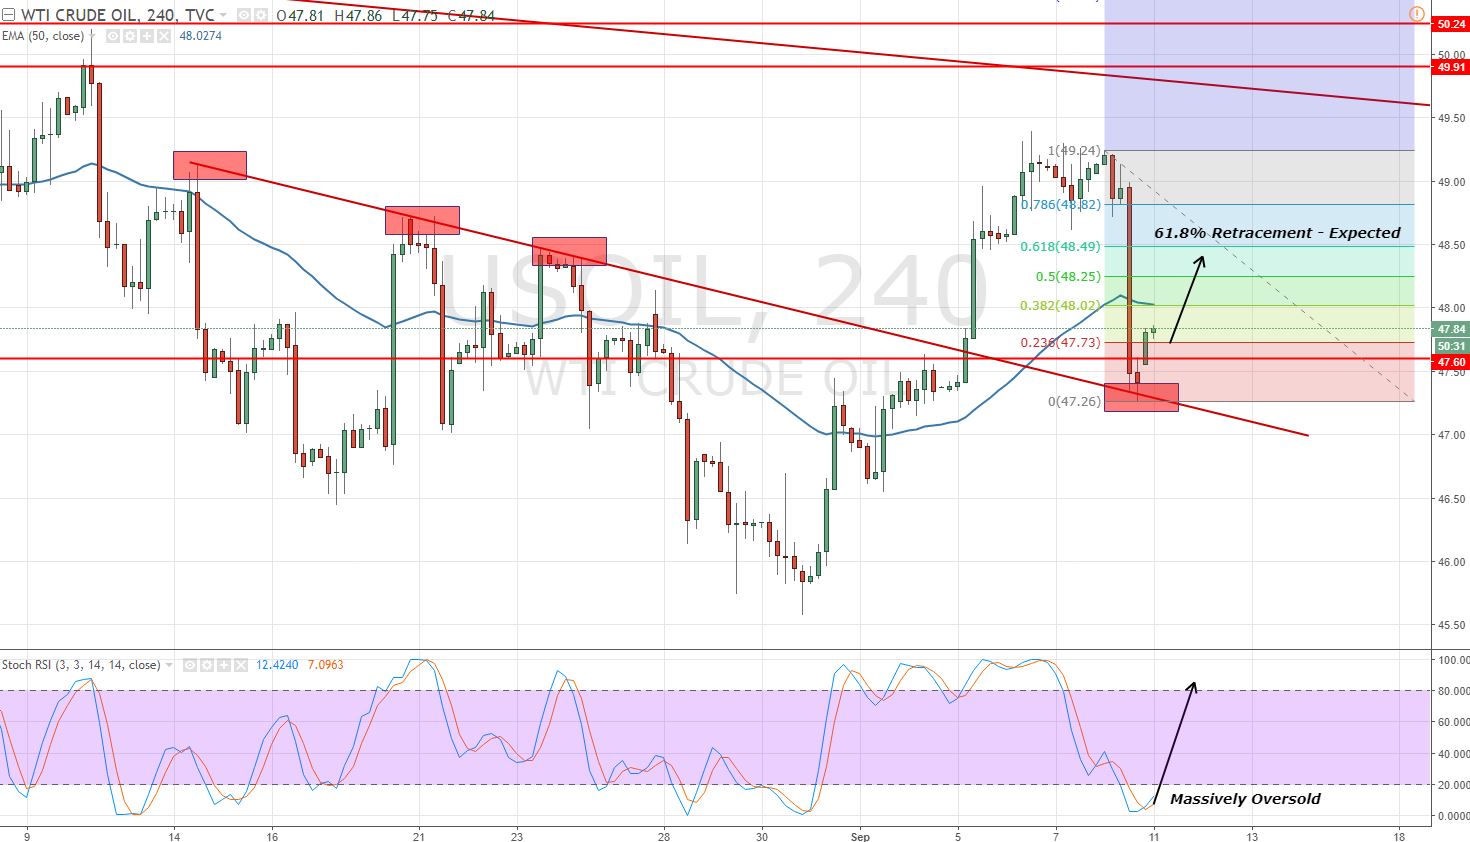
 The drop in the pair has made the Oil massively oversold at 12, which is recommending the bulls are looming around the area. The 50- periods EMA is near $48, suggesting a bearish trend in the oil.
At the moment, we can expect a slight reversal in Crude Oil up to 61.8% Fibonacci Retracement level of $48.49. But before this, Oil has to break above the resistance level of $48 (38.2% retracement level).
Crude Oil Trading Plan
Honestly speaking, the Crude Oil is in the middle of upper and lower limit now ($47 – $48.45). In this scenario, I'm looking to wait a bit for the market to test $47 to enter a Buy position. Else, I will be selling it below $48.50. Good luck!