How to trade Crude Oil In the U.S. Session Today?
It's such an amazing start of the week. Our forex trading signal on EUR/JPY shared in A Quick Trade Setup on EURJPY hit the target for 60 P
It's such an amazing start of the week. Our forex trading signal on EUR/JPY shared in A Quick Trade Setup on EURJPY hit the target for 60 Pips. At this point, I'm looking at Crude Oil to take a sell entry.
Technical View – WIT Crude Oil
As we know, the Crude Oil is trading bullish over the fundamentals coming from the Saudi Arabia. It has made it's way up to $57 barrels per ounce. But now, the bullish momentum seems to suffer due to technical analysis.
Though Crude fundamentals are bullish most of this area already priced in and the technical analysts are all set to take a sell. On the 4 – hour chart, the stochastic is holding above 85. This means the retracement is imminent.
For further confirmation, we can refer to the 3 -hour chart as well. We can see Doji candles followed by a sharp bullish trend. This also indicates a potential reversal in the Crude Oil.
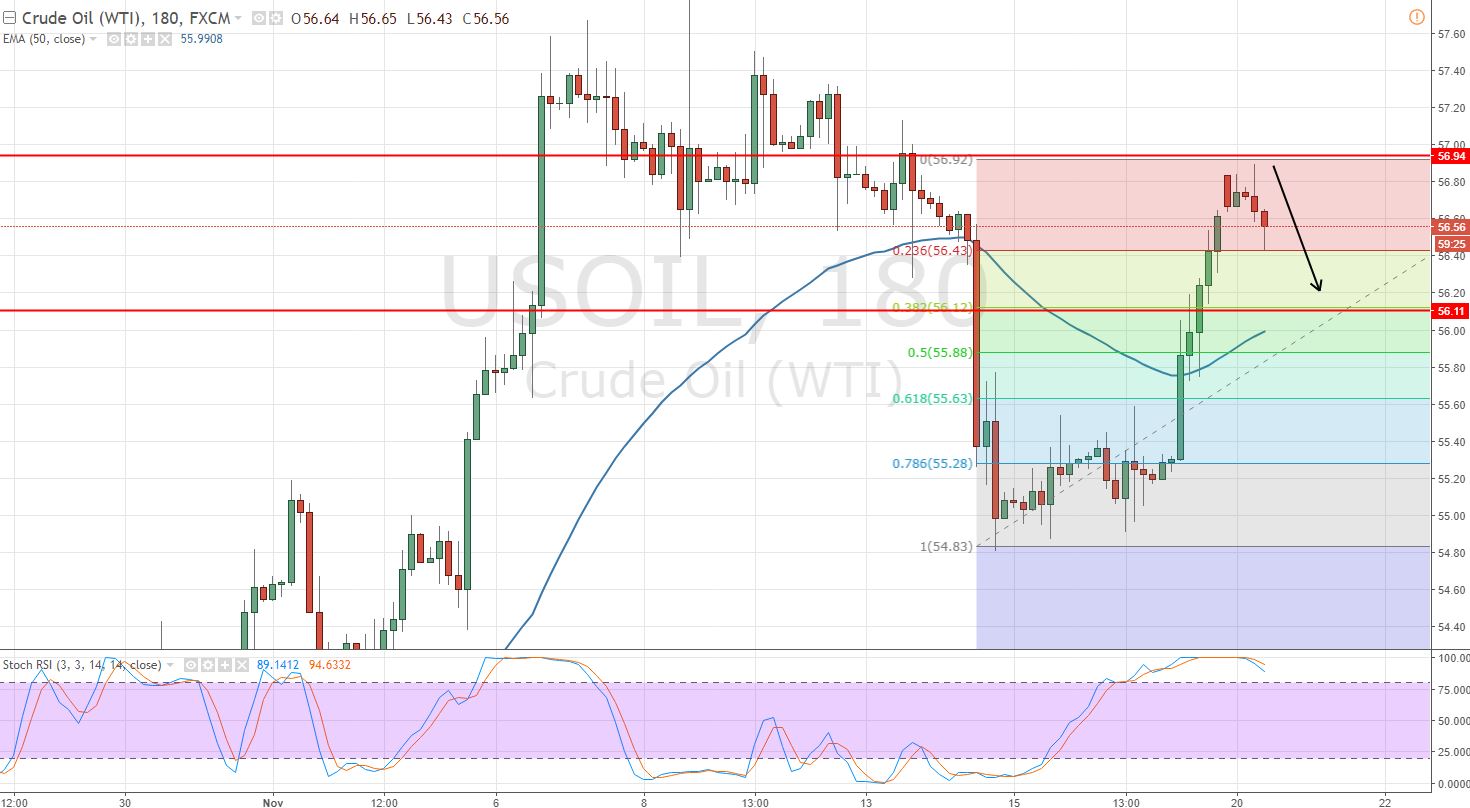
 Crude Oil – 3 – Hour – Fibonacci Retracement
 Crude Oil – 3 – Hour – Fibonacci Retracement
So, let's apply the Fibonacci retracement indicator on the 3- hour chart. The 23.6% retracement remains at $56.43 while 32.85% retracements stays at $56.12. In case the Fibonacci retracement is something you are not familiar, please check out FX Leaders Fibonacci Trading Strategy to understand the Fibonacci trading skills.
Crude Oil Trading Plan
I'm looking to stay bearish below $56.65 with a stop loss of $57.20 to target $56.05 and $55.85. Keep following us for further updates on it. Good luck!
- Check out our free forex signals
- Follow the top economic events on FX Leaders economic calendar
- Trade better, discover more Forex Trading Strategies
- Open a FREE Trading Account