Gold Price Forecast: $2,032 Resistance Looms Amid Fed Hike Fears
Gold's price marginally advances in today's Asian trading, yet it remains shy of the crucial 50-day SMA near $2,032
Gold’s price marginally advances in today’s Asian trading, yet it remains shy of the crucial 50-day SMA near $2,032—a resistance that echoes last week’s peak. Geopolitical strife bolsters the metal’s allure as a haven, with the US dollar’s softening providing further buoyancy.
Despite these tailwinds, gold’s rally is tempered by market anticipation of enduring high US interest rates, a sentiment solidified by the latest FOMC minutes.
These revelations, coupled with a tepid US bond auction, have bolstered yields, potentially restraining bullish gold bets and suggesting prudence for trend continuation.
Middle East Tensions Support Safe Havens
Increasing Middle East tensions, exemplified by recent maritime threats, amplify gold’s status as a sanctuary asset. Escalating hostilities in the region lend gravity to the commodity’s value amidst global market unease.
USD Softness Versus Rate Hike Expectations
While the dollar hovers at a multi-week low—typically a boon for gold—Fed meeting insights have capped significant gains. These minutes have pushed rate cut expectations further out, elevating Treasury yields and tempering gold’s ascent.
Looking Forward: Economic Data and Fed Speeches in Focus
Investors now shift focus to upcoming US economic reports and Fed Governor Philip Jefferson’s remarks, seeking catalysts that could shape gold’s near-term trajectory.
Economic Calendar Highlights:
- Unemployment Claims
- Flash Manufacturing and Services PMI
- Existing Home Sales Data
Gold Price Forecast: Technical Analysis
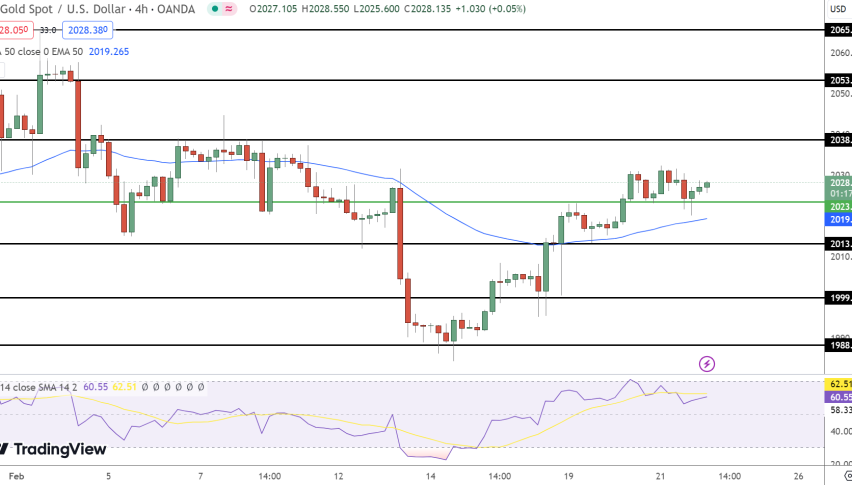
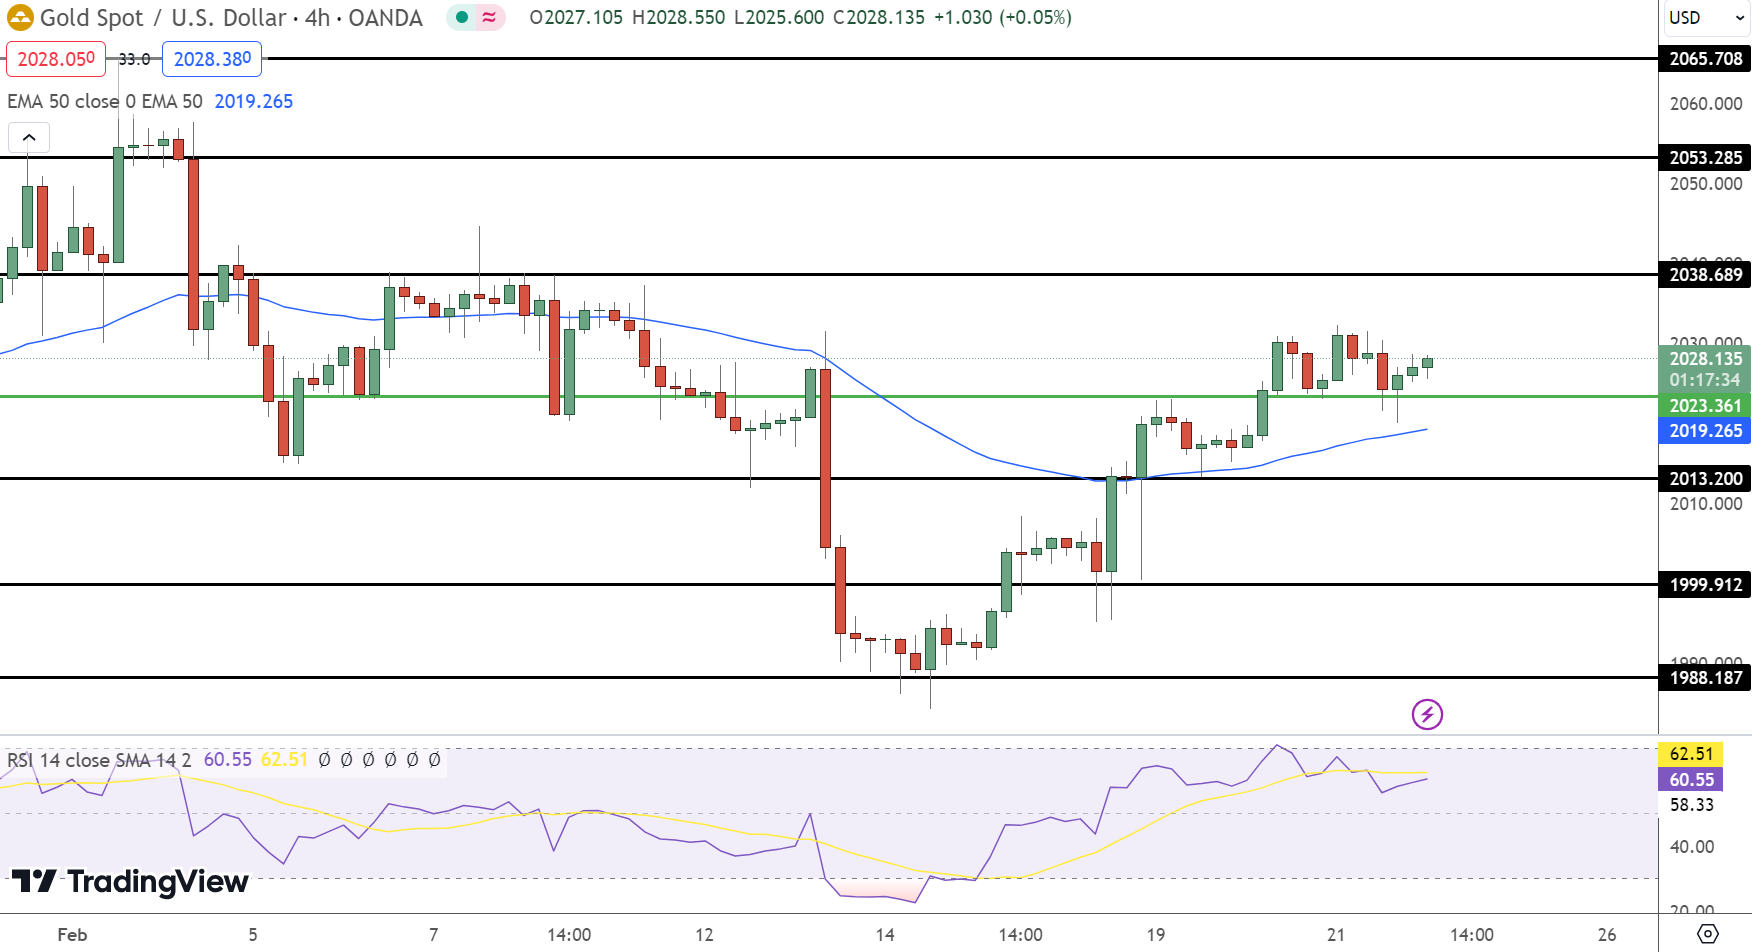
Gold inches up, trading at $2,028.165 with a subtle gain of 0.11%. The metal’s current stance above the pivot point of $2,023.36 suggests a bullish undertone in the 4-hour chart frame.
Resistance levels lie at $2,038.689 and $2,053.285, with a firmer cap at $2,065.708. Support comes into play at $2,013.200, descending to $1,999.912 and $1,988.187.
- Check out our free forex signals
- Follow the top economic events on FX Leaders economic calendar
- Trade better, discover more Forex Trading Strategies
- Open a FREE Trading Account
- Read our latest reviews on: Avatrade, Exness, HFM and XM
Related Articles


Sidebar rates
Related Posts
