S&P 500 Retreats to $5075 Amid Rate Cut Hesitations and Geopolitical Tensions
S&P 500 trading around $5,075. This can be witnessed by the poor performance of the S&P 500 index, which experienced a decline on Tuesday an
Global market sentiment has been bearish since the day started, with the S&P 500 trading around $5,075. This can be witnessed by the poor performance of the S&P 500 index, which experienced a decline on Tuesday and retreated from its record high reached last Friday.
However, the reason for its downward rally can be attributed to mixed economic indicators and geopolitical tensions, which contributed to the downward pressure on the S&P 500. It should be noted that Jerome Powell signaled that the Fed won’t cut rates soon. This disappoints markets, causing stock sell-offs.
Fed’s Interest Rate Stance and US Economic Figures Shape Market Sentiment
On the US front, the Federal Reserve’s stance on interest rates and previously released key economic data have been closely watched by investors as it exerted downward pressure on the market sentiment and the performance of the S&P 500. Despite concerns about inflationary pressures, Fed Chair Jerome Powell signaled that a rate cut in March is unlikely. Some other Fed officials want to wait and see more proof before they decide.
However, this cautious approach has provided some stability to the market, easing fears of abrupt policy changes. Moving ahead, upcoming economic releases, including durable orders data and PCE numbers, will offer further clarity on the health of the US economy and its impact on the S&P 500.
Geopolitical Tensions and Their Implications for the S&P 500
On the geopolitical front, the ongoing conflict between Israel and Gaza was seen as another factor that pushed the S&P 500 down. President Joe Biden’s remarks regarding a potential halt in fighting during the Muslim fasting month of Ramadan have provided some hope for de-escalation, but uncertainties persist.
Investors are closely monitoring developments in the region. Therefore, situations like these remind us that global markets are connected and we need to stay alert during uncertain times.
S&P 500 Price Forecast: Technical Analysis
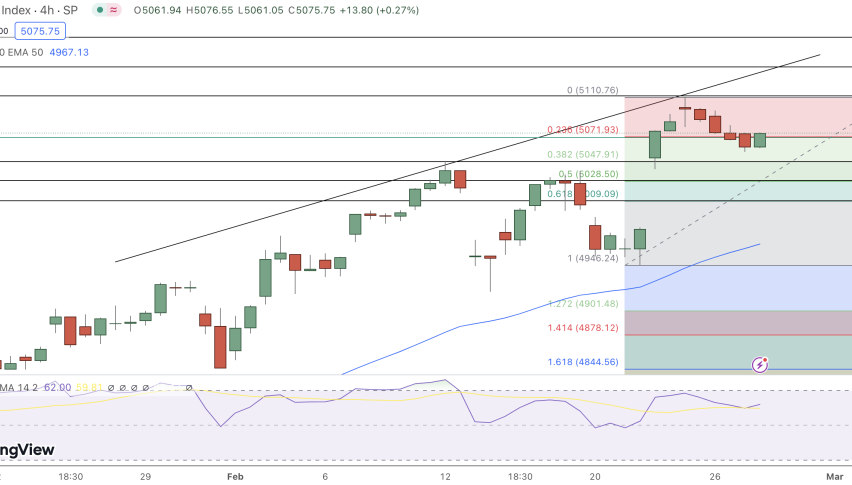
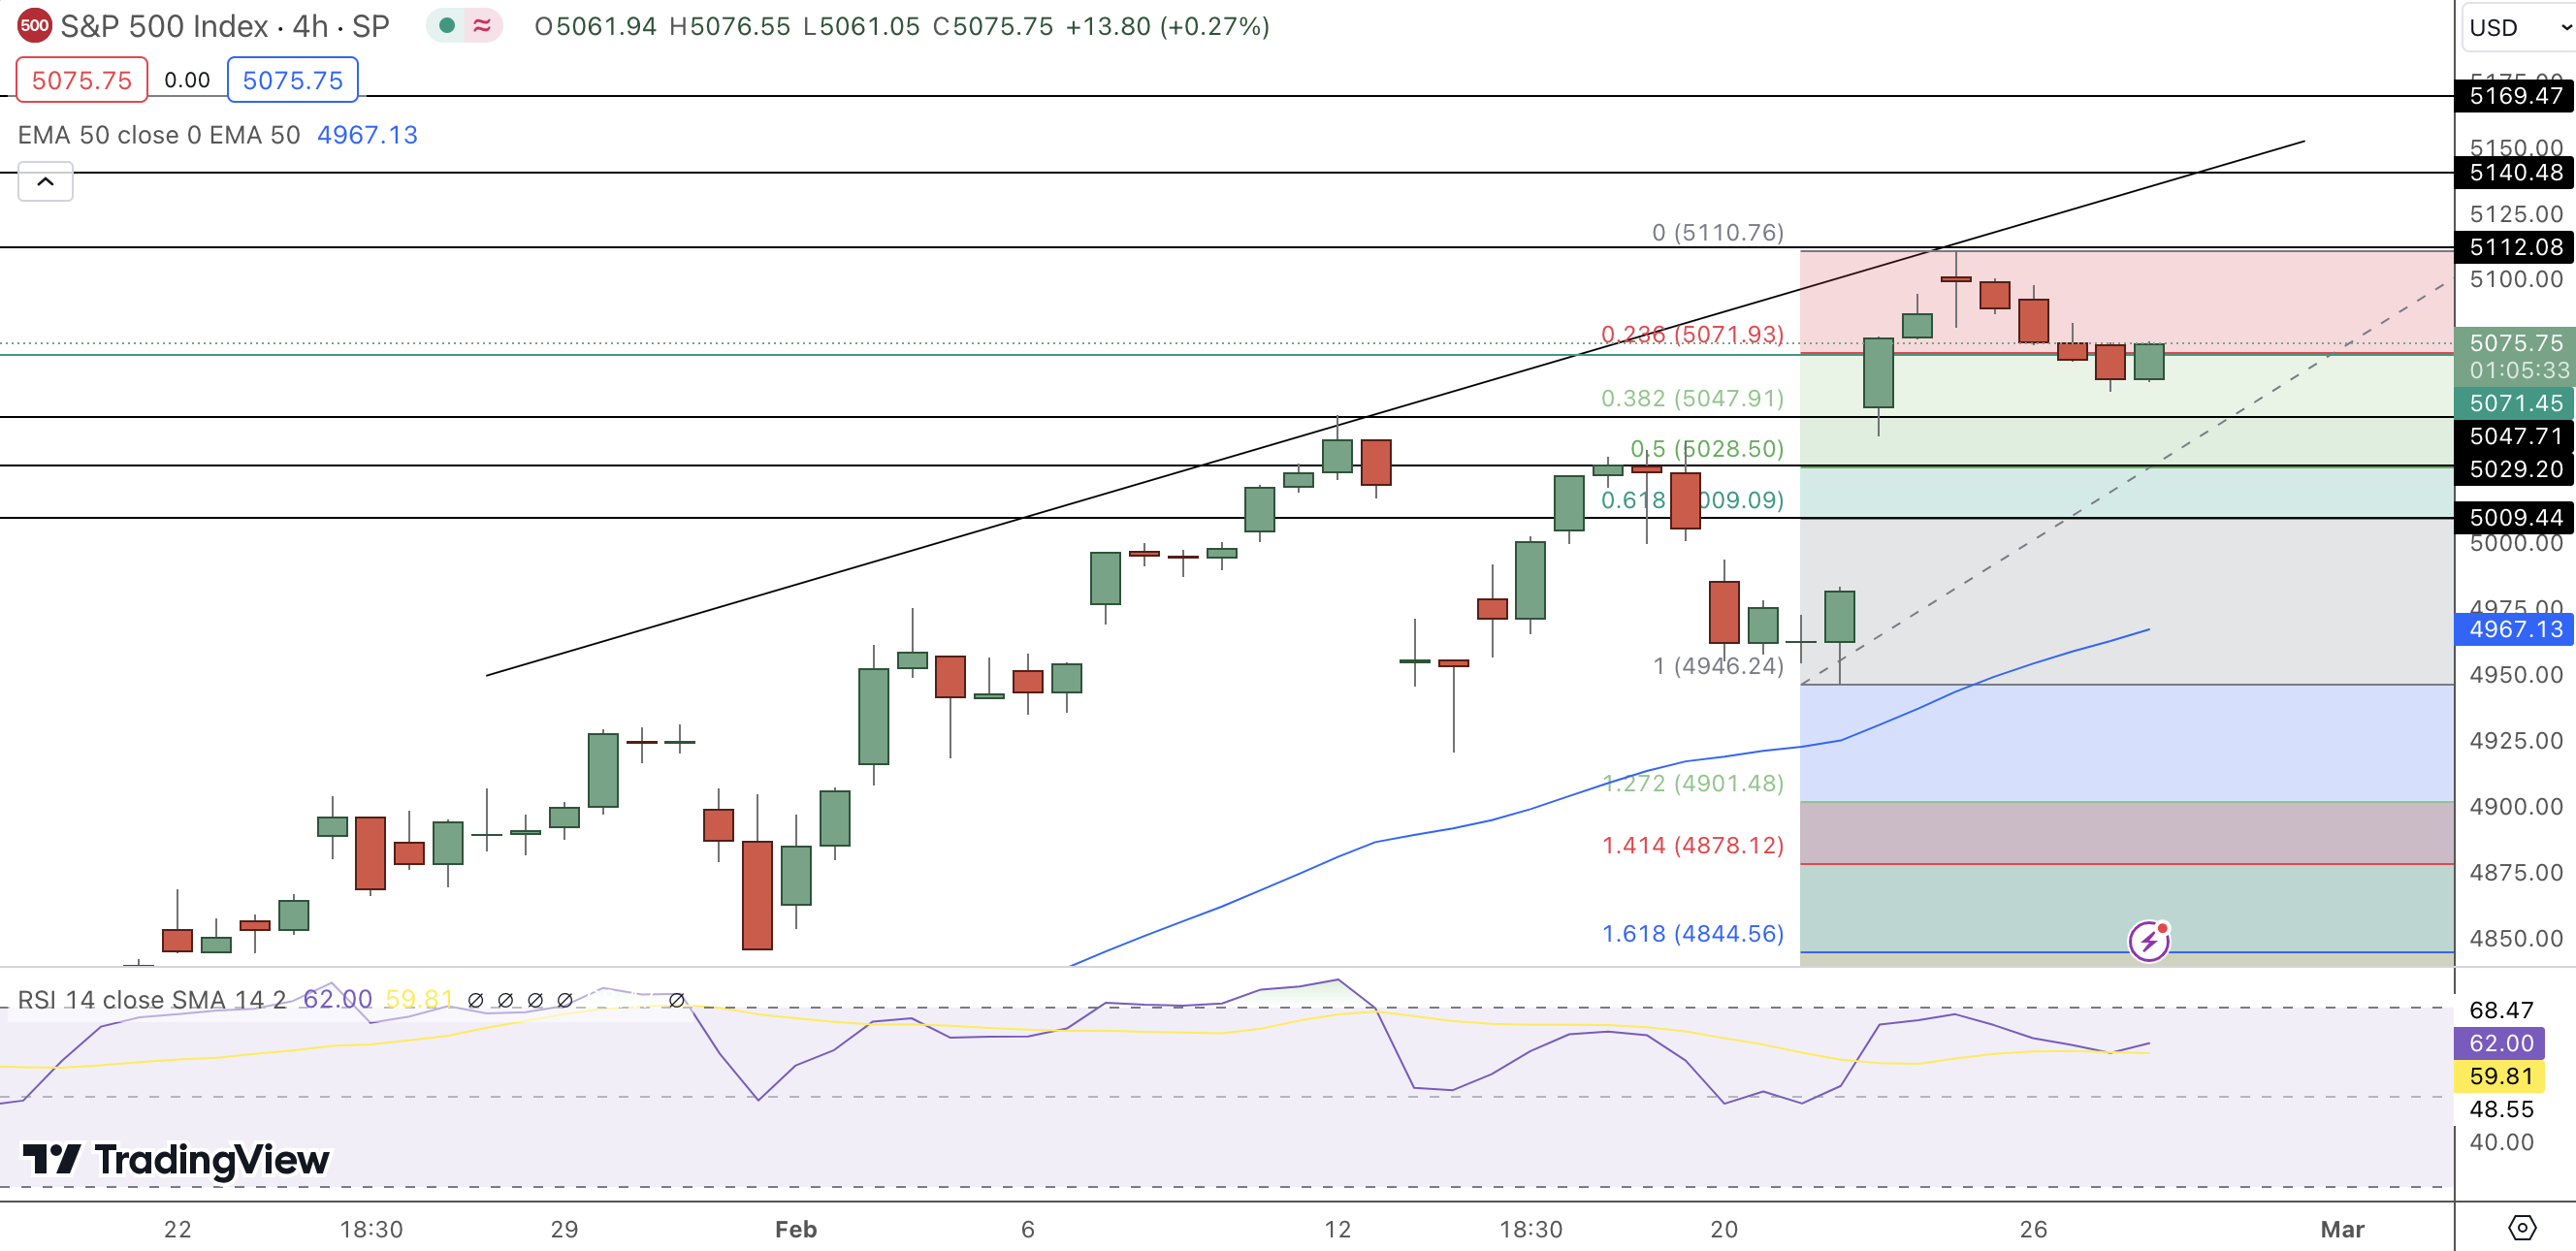
The S&P 500’s recent dip from the $5,100 level to $5075, marking a 0.38% decrease, underscores a moment of reflection in the market’s trajectory. With a pivot point at 5071.450, the index teeters on the edge of bullish and bearish territories.
Immediate resistance levels at 5112.080, 5140.480, and 5169.470 delineate the hurdles ahead, while support levels at 5047.710, 5029.200, and 5009.440 offer a cushion against further declines. The RSI at 61, coupled with a 50 EMA of 4958.640, signals a market that is leaning towards bullishness, yet cautiously so.
The S&P 500’s fate hinges on its ability to sustain above the 5070 mark, a critical juncture that could dictate the market’s direction in the near term. Investors eyeing these technical indicators might see a trend that, while tentatively bullish above 5070, demands vigilance against potential volatility.
- Check out our free forex signals
- Follow the top economic events on FX Leaders economic calendar
- Trade better, discover more Forex Trading Strategies
- Open a FREE Trading Account
- Read our latest reviews on: Avatrade, Exness, HFM and XM
Related Articles


Sidebar rates
Related Posts
