Forex Signals Brief March 1: Eurozone Inflation to Fall to 2.5%
Inflation is expected to soften further in Europe, while we also have manufacturing data coming from China and the US


Today’s Market Expectations
Today started with the services and manufacturing PMI reports from China, as well as the Caixin manufacturing. Services and Caixin manufacturing have come out of contraction, although the activity is not so hot, remaining close to stagnation.
Soon the Eurozone Consumer Price Index (CPI) report will be released and the annualized YoY number is forecasted to fall 2.5%, showing a decrease from 2.8% the previous year. Meanwhile, the Core CPI YoY is expected to stand at 2.9%, down from 3.3% the previous year. Despite the Core 3-month and 6-month annualized rates already being below the European Central Bank’s (ECB) 2% target, the ECB remains resolute in its stance. Some members, including President Lagarde, have expressed the need to assess Q1 2024 wage data before contemplating a rate reduction. The market has fully priced in a 25 basis point rate cut in June. However, if economic data falls short of expectations, the market is likely to anticipate a rate cut as early as April, despite the ECB’s communicated message.
The ISM Manufacturing Purchasing Managers’ Index (PMI) in the United States is expected to rise to 49.5 from 49.1 previously. This forecast reflects a slightly positive outlook, especially considering the recent increase in the S&P Global Manufacturing PMI to 51.5 from 50.7 the previous month. The upward trend in manufacturing activity suggests a recovery in the sector following the recession of the previous two years. Overall, sentiment remains cautiously optimistic regarding the performance of the manufacturing industry.
Yesterday the volatility in the cryptocurrency market slowed, while in forex the situation was quiet until the release of the US PCE inflation report, which sent Gold surging and the USD lower initially. Then the USD reversal came and it surged 60 pips higher across the board. We opened several trading signals, but only two closed during the day.
The Jump in Gold Stops at $2,050
Gold prices have experienced a rebound above $2,000 after a recent drop earlier in the month. Last week, there were multiple attempts by buyers to push the price above the 50-day Simple Moving Average (SMA) line (yellow), but these attempts were unsuccessful initially. However, on Friday, there was a notable surge in gold prices, resulting in the price breaking above the 50 SMA line convincingly. Despite this breakout, the price of gold has since dipped back below the 50 SMA line this week and is currently trading within a range above the $2,030 mark. This suggests some indecision or resistance in the market, as traders assess the next potential direction for Gold prices.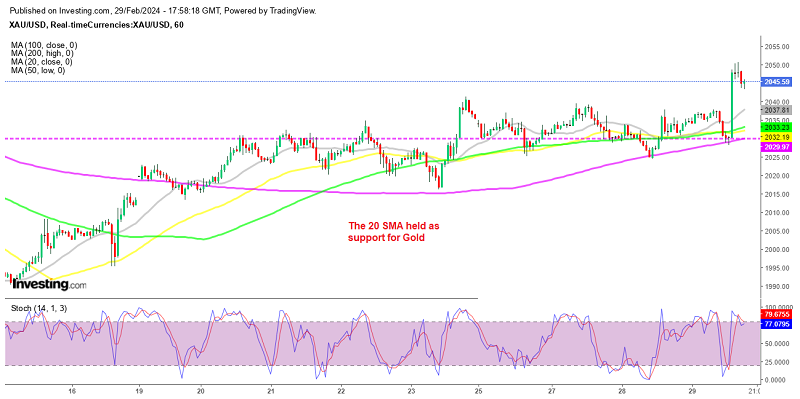
XAU/USD – H1 chart
USD/CHF Breaks Above the Range
The release of the US core and headline PCE data meeting expectations has relieved the market, resulting in a weakening of the Swiss Franc against the US Dollar (CHF/USD). The Swiss Franc appears to be particularly affected by the inflation numbers, as evidenced by its decline of approximately 60 pips thus far. Currently, the Swiss Franc is displaying notable strength and continues to push higher against the US Dollar and it closed the day at the top.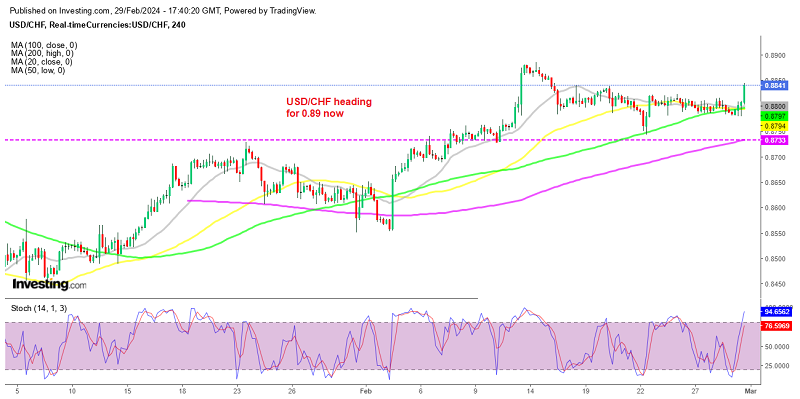
USD/CHF – H4 chart
Cryptocurrency Update
The 50 SMA Holds As Support for Bitcoin
Bitcoin is spearheading a rally in the cryptocurrency market, surpassing significant milestones and approaching its all-time high below $69,000. Following its breakthrough above the $50,000 mark, Bitcoin has maintained its upward momentum, surpassing $55,000 earlier this month. Yesterday, it surged above $60,000, reaching a peak of approximately $63,800. We initiated a buy signal for Bitcoin when its price was below $60,000, but subsequently closed it as Bitcoin retraced following the surge. Yesterday the price dipped to the 50 SMA (yellow) where it found support, however the 20 SMA is turning into resistance now.
BTC/USD – 60 minute chart
Ethereum retreating Below MAs
Ethereum has likewise experienced a notable surge in value recently, mirroring the upward trajectory of Bitcoin. However, the bullish momentum seems to be somewhat tempered in comparison. This is reflected in the behavior of the 50-period simple moving average (SMA) line, depicted in yellow on the hourly (H1) chart, which has been acting as a support level. On Wednesday, ETH/USD reached close to $3,500 before experiencing a decline of $400. yesterday the 50 SMA was broken after holding as support several times. 
- ETH Buy Signal
- Entry Price: $2,290
- Stop Loss: $2,590
- Take Profit: $1,750
- Check out our free forex signals
- Follow the top economic events on FX Leaders economic calendar
- Trade better, discover more Forex Trading Strategies
- Open a FREE Trading Account
- Read our latest reviews on: Avatrade, Exness, HFM and XM
Related Articles


Sidebar rates
Related Posts
