The 10 Cent Decline Stalls at the 100 Daily SMA for USDJPY
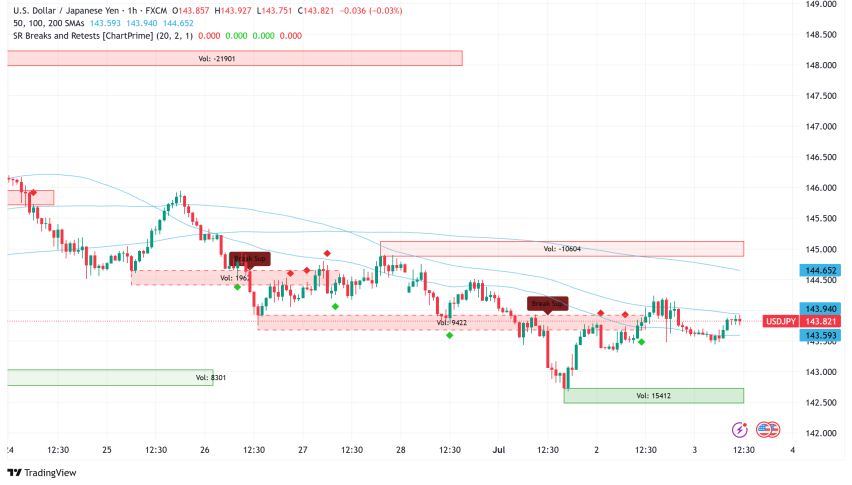
USD/JPY has turned bearish in July, losing exactly 10 cents, with the decline accelerating this week. But, the fall stopped at the 100 SMA.

USD/JPY has turned bearish in July and has crashed exactly 10 cents lower with the decline accelerating this week. Moving averages have been offering some support for the price on the way down, but they are now being broken one after the other. Earlier this month, the price found some support at the 50 SMA (yellow), but sellers quickly pushed it below this level.

Then the 100 simple MA (green) took over as support last week, but that moving average was broken this week as the decline resumed and now the 100 smooth MA (red) is doing this job, having stopped the fall yesterday. The price bounced 200 pips higher off that moving average and the daily candlestick closed as a doji, which is in fact a bullish reversing signal after the 10-cent decline in USD/JPY .
USD/JPY Chart Daily – The 100 SMA Held Yesterday
The USD has been rallying steadily against the major currencies since last Wednesday, although it has been falling against the Japanese Yen. The economic data continues to suggest that the US economy remains resilient with inflation slowly falling back to target. Overall, this should continue to support the soft-landing narrative and be positive for risk sentiment and hurt safe havens such as the JPY, but that’s not helping USD/JPY buyers.
The US dollar has been making decent gains against most major currencies for more than a week, although it has weakened against the Japanese yen. Economic data continues to indicate that the U.S. economy is in a good shape, with inflation gradually moving towards the 2% target. This scenario typically supports the soft-landing narrative, enhances risk sentiment, and usually weakens safe-haven currencies like the Japanese yen. However, this hasn’t been the case for USD/JPY buyers this m month.
The Japanese yen has appreciated significantly against all major currencies. This strength has been partly attributed to intervention by the Bank of Japan (BOJ) and the breach of a key trendline in USD/JPY. However, there is still a lack of strong fundamental support for the yen’s rise. There is speculation that this movement may be due to positioning for a potential BOJ rate hike. If so, this situation could present a good “sell the fact” opportunity for buying USD/JPY, especially following last night’s Tokyo Core CPI inflation reading.
Tokyo Core CPI Inflation YoY for July
- Tokyo Headline CPI Inflation YoY: 2.2% (vs. 2.3% prior)
- Core CPI Excluding Fresh Food & Energy YoY: 1.5% (vs. 1.6% expected; prior 1.8%)
- CPI Excluding Fresh Food YoY: 2.2% (vs. 2.2% expected; prior 2.1%)
Insights on Tokyo Area Inflation Data
- National CPI Data Timeline: The national-level Consumer Price Index (CPI) data for Japan will be released in approximately three weeks, as it requires more time for data collection and analysis compared to Tokyo’s regional data.
- Significance of Tokyo CPI: Tokyo’s CPI is a sub-index of the national CPI and is considered a leading indicator of inflation trends across Japan. Given Tokyo’s status as Japan’s largest city and a key economic hub, its CPI data often provides early signals of broader national trends.
- Comparative Cost of Living: Historically, Tokyo’s CPI has tended to be slightly higher than the national average, reflecting the city’s relatively higher cost of living, including factors such as elevated rent prices.
USD/JPY Live Chart
- Check out our free forex signals
- Follow the top economic events on FX Leaders economic calendar
- Trade better, discover more Forex Trading Strategies
- Open a FREE Trading Account


