Bitcoin Crashes After Strong US Factory Data: Back To $60k?
Bitcoin is under pressure following unexpectedly bullish factory news in the United States. Will BTC recover or fall to $60,000?

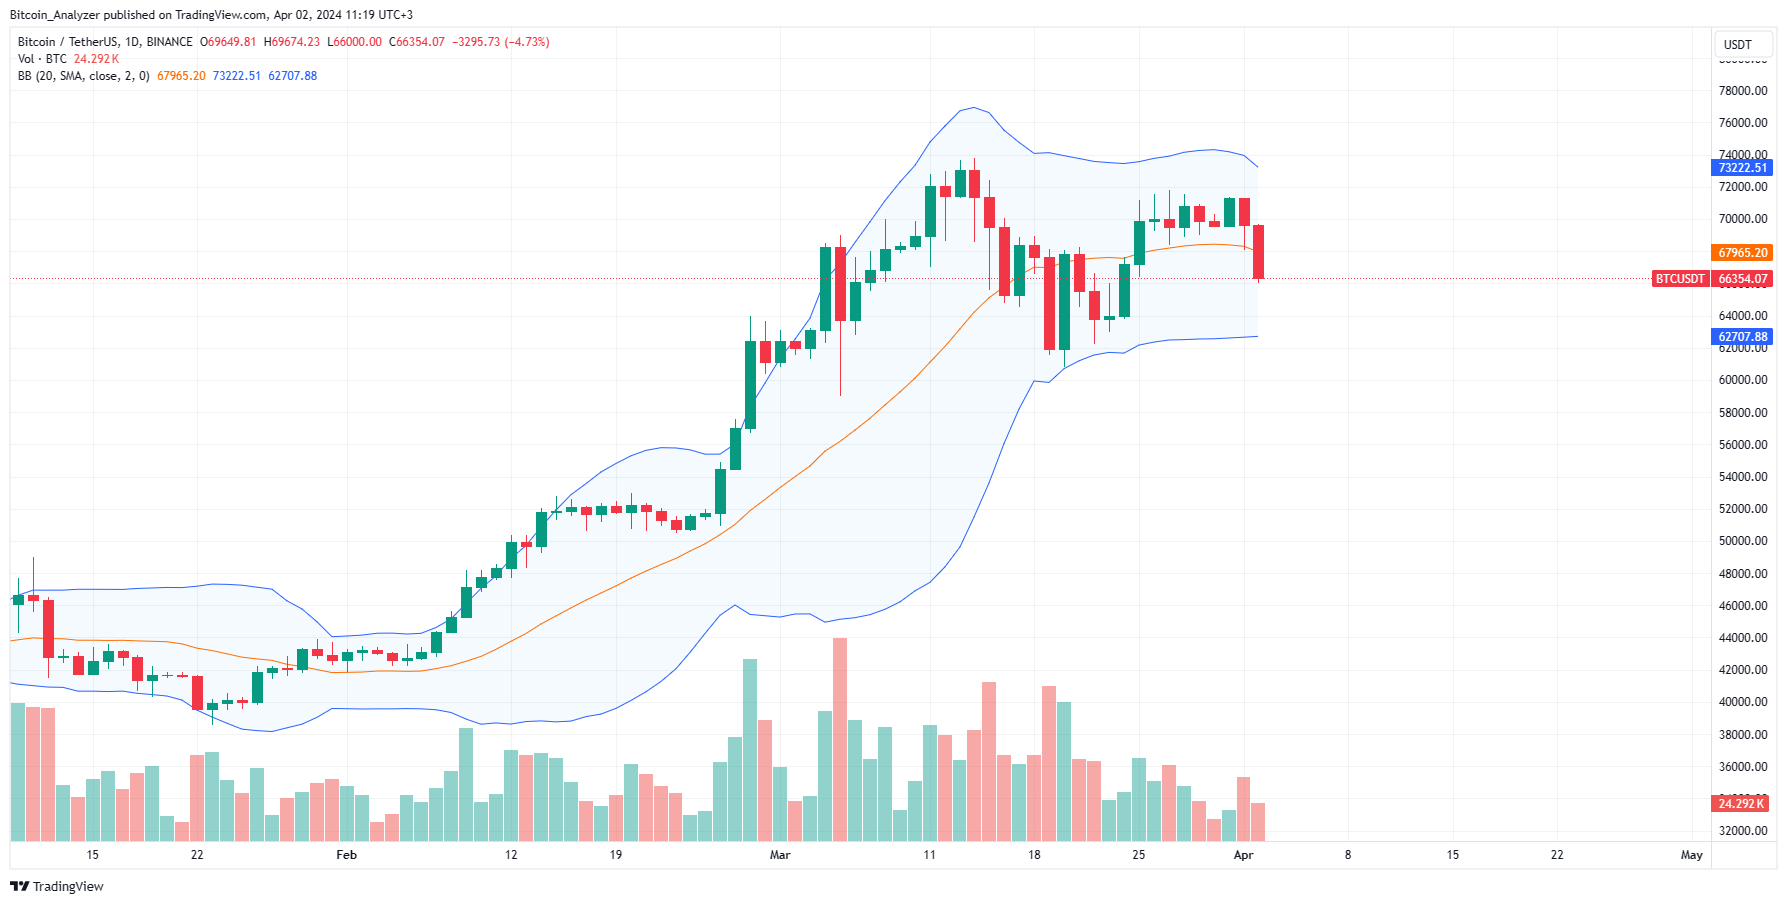
Bitcoin is trending lower at press time, looking at the formation in the daily chart. Even though bulls are confident, the drop is a shake of confidence. Following the crash in the Asian session, the uptrend will only be valid if there is a complete reversal, pushing the coin above the $71,700 level.
So far, Bitcoin is down 5% in the previous trading day, pushing weekly losses to around 6%. The sell-off, as expected, pushed trading volume higher to 77%, indicating that traders are exiting. Of all, the collapse of prices forced the coin’s market cap down by 4% to around $1.3 trillion.
The following Bitcoin news events might influence price action in the coming sessions:
- Tether Holdings, the issuer of USDT—the world’s largest stablecoin by market cap—bought 8,888 BTC worth over $618 million, according to a recent announcement. Their holdings now stand at over 75,000 BTC, at an average price of around $30,000.
- The drop in BTC prices follows the release of better-than-expected PMI data. Statistics show that factory activity in the United States unexpectedly expanded in March. This rapid expansion was noteworthy and comes for the first time since September 2022. Some expect the FED to possibly reduce the number of rate cuts in 2024.
Bitcoin Price Analysis
BTC/USD remains bullish, looking at the formation in the daily chart.
Despite the crash on April 2, buyers stand a chance. Any rejection of lower lows today above $71,700 might reinforce this forecast.
Even so, the crash below the local support of around $68,300 is bearish. Accordingly, traders might look to short in the short term, aiming for $61,500.
Further losses below this line might trigger further losses towards $60,000 or worse in the medium term.
- Check out our free forex signals
- Follow the top economic events on FX Leaders economic calendar
- Trade better, discover more Forex Trading Strategies
- Open a FREE Trading Account
- Read our latest reviews on: Avatrade, Exness, HFM and XM
Related Articles


Sidebar rates
Related Posts
