GBP to USD Tests the Support at 1.25 After the UK GDP Report
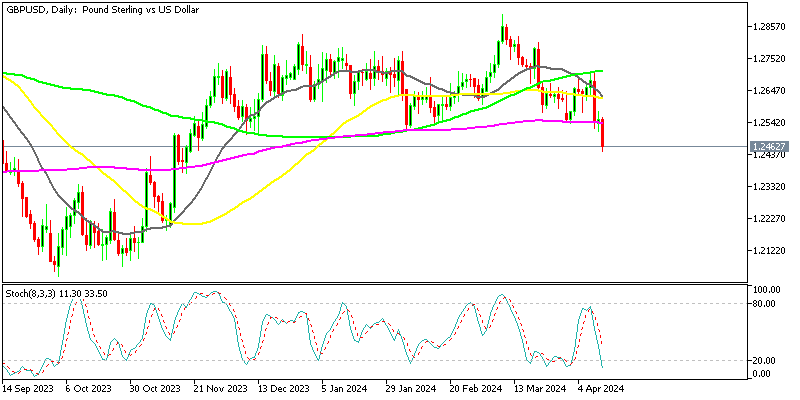
The GBP to USD exchange rate has been trading within a 3 cent range this year, fluctuating between 1.25 and 1.28. In early March, buyers managed to push the price close to 1.29, but there was limited follow-through momentum, and the currency pair subsequently retreated. The retreat brought the GBP/USD pair back toward the 200-day Simple Moving Average (purple), and sellers even pushed below it yesterday. The 200-day SMA is often considered a key long-term trend indicator, and its presence as a support level suggests that there may be significant market interest or sentiment around that price level.
GBP/USD Chart Daily – The 200 SMA Has Been Pierced
On Wednesday, the price of GBP/USD declined below both the March low and the 200-day moving average, which was situated at 1.2535. Additionally, the price breached the low from the previous Friday, as well as the low from March 22, near 1.2574. These levels represent significant support levels, and their breach signals heightened risk for short-term traders who are anticipating further downward movement. Staying below these key levels maintains a bearish bias in the market, firmly placing control in the hands of sellers or bears. This suggests that there may be continued downward pressure on the GBP/USD pair in the short term.
UK February GDP Report
- Month-on-Month (m/m) GDP: Growth was recorded at 0.1%, in line with expectations and consistent with the previous month’s figure of 0.2%.
- Year-on-Year (y/y) GDP: Contrary to expectations of a -0.4% contraction, GDP showed a slight decline of -0.2%, improving from the previous -0.3% figure.
- Services Sector: Month-on-month growth in the services sector was 0.1%, a slight decrease from the previous month’s 0.2%.
- Industrial Production: Year-on-year industrial production exceeded expectations, growing by 1.4%, surpassing the forecasted 0.6%.
- Construction Output: There was a significant month-on-month decrease of -1.9% in construction output, falling short of the expected -0.4% and contrasting with the previous month’s growth of 1.1%.
- Goods Trade Balance: The UK’s goods trade balance stood at -£14.212 billion, slightly better than the anticipated -£14.5 billion and compared to the previous reading of -£14.51 billion.
- Manufacturing Production: Month-on-month manufacturing production recorded growth of 1.2%, significantly higher than the expected 0.1%, and an improvement from the previous month’s 0.0%.
- GDP Estimates: The GDP estimate for the 3-month period ending in February showed growth of 0.2%, surpassing the forecasted 0.1% and improving from the previous -0.1%. However, the month-on-month and year-on-year GDP estimates were both lower than expected.
- Goods Trade Balance (Non-EU): The goods trade balance with non-EU countries stood at -£14.2 billion, compared to the previous -£3.421 billion.
- Manufacturing Production (y/y): Manufacturing production showed strong growth of 2.7% year-on-year, exceeding the previous 2.0%.
GBP/USD Live Chart
| Broker | Website | |
|---|---|---|
| 🥇 |  | Visit Broker >> |
| 🥈 |  | Visit Broker >> |
| 🥉 |  | Visit Broker >> |
| 4 |  | Visit Broker >> |
| 5 |  | Visit Broker >> |
| 6 |  | Visit Broker >> |
| 7 |  | Visit Broker >> |


