Forex Signals Brief July 25: Eyes on USD GDP and Jobless Claims
Today the US jobless claims will show how employment is doing while the GDP will show the trend of the economy.

The U.S. stock market experienced a negative start yesterday which ended even worse, impacted by disappointing earnings reports from Alphabet and Tesla released after the market close on Tuesday. Former Fed Governor Dudley expressed concerns that the negative unemployment cycle was beginning and cautioned that the Fed should not delay rate cuts, suggesting it might already be too late to prevent rising unemployment. These remarks, alongside the earnings reports, contributed to the S&P and Nasdaq having their worst trading days since late 2022. In the Forex market, the JPY and CHF benefited as investors sought safer assets.

Meanwhile, the Bank of Canada cut interest rates by 25 basis points for the second consecutive meeting, reducing the rate from 4.75% to 4.5%. This action caused the USD/CAD to surpass the 1.38 level and reaching a high of 1.3816, marking the highest point in the trading range since April. The question remains whether the price can sustain its momentum and approach the year’s high of 1.3845 today.
Today’s Market Expectations
Yesterday the USD retreated lower during the Asian and European sessions, but made a reversal in the US session, which in the end left most assets trading in a narrow range. The volatility was lower as well, so we only had two trading signals reaching their targets, both of which hit the take profit, while several other trades remained open.
Gold Returns to the Lows
Yesterday, gold prices rose from an initial level of $2,400 to a peak of $2,430 during the early U.S. session. This increase was part of a broader trend toward safer investment options, as investors turned to gold, a traditional safe-haven asset, following declines in global stock markets. Despite breaking above the 50-day SMA, gold failed to sustain upward momentum and reversed, forming a doji candlestick, a bearish reversal signal. Later in the U.S. session, XAU/USD retreated back into its previous range, dropping below $2,400 and breaching the 100-day SMA.
XAU/USD – Daily chart
AUD/USD Falls to the Bottom of the Previous Range
After slipping back into its previous range, the pair has relinquished its 200-pip gain from earlier this month. It is now testing the lower boundary of this range, marked by the red 100-day SMA. As Australia heavily depends on exports to China for economic growth, the AUD/USD has been declining for the past two weeks due to traders reacting to China’s slowing growth. Following last week’s re-entry into the range, the AUD/USD’s decline has intensified this week. However, it has reached critical support at its rising 100-day moving average, currently at 0.66. Prices haven’t dropped below this moving average since May 2, with stop losses anticipated if it breaks below. We expected buyers to lean against the moving average.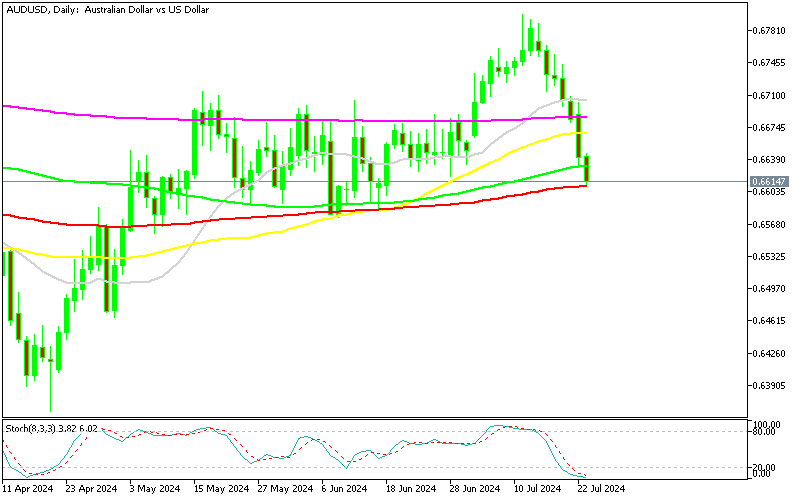
AUD/USD – Daily Chart
Cryptocurrency Update
Bitcoin Consolidates Around $68,000
Earlier this month, Bitcoin experienced a sharp decline, falling below $60,000 and dragging the overall cryptocurrency market down, with Bitcoin dropping to under $53,000. However, buyers quickly returned, pushing the price back above $60,000 and past key moving averages. The recovery paused briefly above $65,000, but the 100-day SMA (green) on the daily chart provided support, allowing Bitcoin to continue its upward trajectory, reaching $68,000 over the weekend.
BTC/USD – Daily chart
MAs Turn into Support for Ethereum
Ethereum has been experiencing a series of lower highs since early March, even after the launch of the ETH ETF. It peaked at $3,830 before declining in June and falling below $3,000 earlier this month. Buyers then stepped in, lifting the price to the 50-day SMA (yellow), which had previously acted as resistance. The persistence of the buyers has now turned the 50 SMA into a supportive level.
ETH/USD – Daily chart
- Check out our free forex signals
- Follow the top economic events on FX Leaders economic calendar
- Trade better, discover more Forex Trading Strategies
- Open a FREE Trading Account
- Read our latest reviews on: Avatrade, Exness, HFM and XM
Related Articles


Sidebar rates
Related Posts
