S&P 500 and Dow Jones Still in Retreat, but Uptrend Remains Intact
Stock markets have gone surged since October, but they are in a retreating period. However MAs are keeping S&P 500 and Dow Jones bullish.
Stock markets have gone through a massive rally since October, but they are in a retreating period. However, MAs are keeping S&P 500 and Dow Jones supported on the daily chart, having stopped the fall last Friday and also providing support today, so chances are for a bullish revrsal and a resumption of the uptrend.
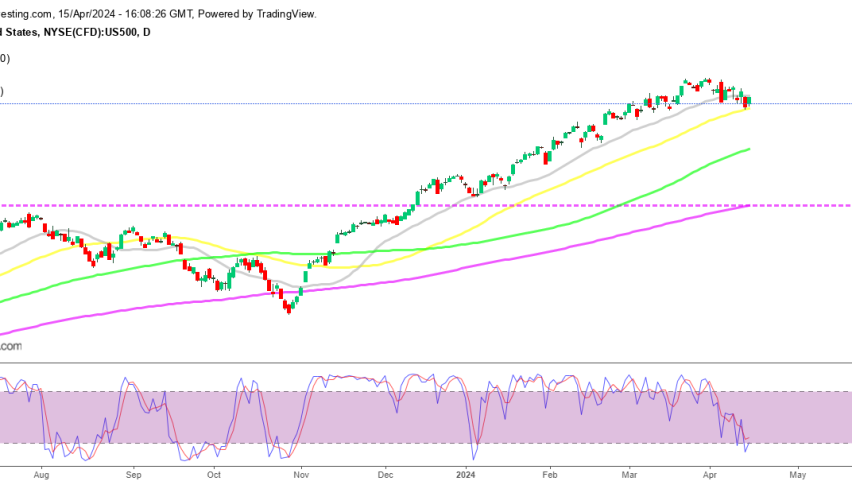
S&P 500 Chart Daily – The 50 SMA Is Holding As Support
Two weeks ago stock markets retreated from all time highs and experienced a downturn, breaking below the 20 SMA (gray) on the daily chart. Last Friday the decline resumed again and S&P 500 fell to the 50 SMA (yellow), as risk-off sentiment spread across markets in response to news of potential Iranian retaliation. Iran reportedly launched an operation against Israel however no reported casualties. Besides that, there are indications of a general de-escalation, with the US warning Israel against reprisals, which has left traders in passivity today, awaiting more news.
As we await upcoming economic data as well during the week, there’s a possibility of a return to positive risk sentiment which would send stock indices higher, bouncing off the 50 daily SMA. It’s worth noting in the S&P 500 that the stochastic indicator is oversold on the daily chart, which suggests that the price is oversold and a reversal higher is due.
Such divergence often precedes pullbacks or reversals in price trends. The break of the trendline and the 20-day moving average signaled trouble for buyers, potentially leading to a larger decline below the 5,000 level. However, the decline stopped at the 50 SMA last Friday, above the price dipping towards the first major support level at 5.100 points amid risk-off flows before the weekend. So, this moving average may attract buyers looking to position themselves for a rally toward a new all-time high. So, we are thinking of opening a long term buy S&P 500 signal as well.
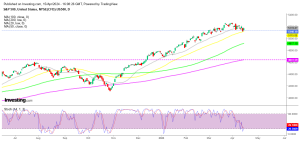
Dow Jones Chart Daily – The Decline Has Stopped At the 50 SMA As Well

The Dow Jones Industrial Average closed lower by 500 points, or 1.30%, ending last Friday at 37,984. These significant movements reflect the heightened volatility and downward pressure experienced across major indices during the day. However, today Dow is higher after bouncing off the 100 SMA (green).
S&P 500 Index Live Chart
- Check out our free forex signals
- Follow the top economic events on FX Leaders economic calendar
- Trade better, discover more Forex Trading Strategies
- Open a FREE Trading Account
- Read our latest reviews on: Avatrade, Exness, HFM and XM
Related Articles


Sidebar rates
Related Posts
