Gold Price Forecast: Hits $2318, Eyes on US GDP Report and Fed Rate Decisions
Today's Gold (XAU/USD) price forecast sees the metal trading at $2318.095, marking a slight increase of 0.10%.
Today’s Gold (XAU/USD) price forecast sees the metal trading at $2318.095, marking a slight increase of 0.10%. After reversing from a recent low, gold reached an intraday high of $2,328.85, buoyed by a dip in the US Dollar which generally boosts appeal for the yellow metal across other currency holders.
Impact of the USD on Gold Prices
Despite robust U.S. economic indicators and assertive comments from Federal Reserve officials suggesting sustained high interest rates, the US Dollar has dipped slightly. This downturn has made gold more accessible to international buyers, increasing its demand.
However, gold’s potential gains are tempered as the market anticipates further details on the Fed’s monetary policy direction.
Upcoming economic releases, such as the Advance Q1 GDP report and the PCE Price Index, will be pivotal in shaping the Dollar’s trajectory and, consequently, influencing gold prices.
Economic Data Influencing Market Trends
Recent data from the US Census Bureau highlighted a 2.6% increase in durable goods orders in March, a positive signal for the manufacturing sector. Excluding transportation, orders saw a marginal increase of 0.2%.
Additionally, forecasts suggest the Advance GDP report due later today will show a 2.5% growth rate for the first quarter, a decrease from the previous quarter’s 3.4%.
These figures are crucial as they provide insight into the broader economic landscape, affecting investor sentiment towards riskier assets and safe havens like gold.
Geopolitical Developments and Gold Demand
Reduced geopolitical tensions, particularly in the Middle East, have lessened the allure of safe-haven assets such as gold.
With Iran scaling back its military presence in southern Syria and easing tensions with Israel, the market’s risk appetite has increased, diverting interest from gold to higher-risk investments.
Technical Analysis and Trading Strategy
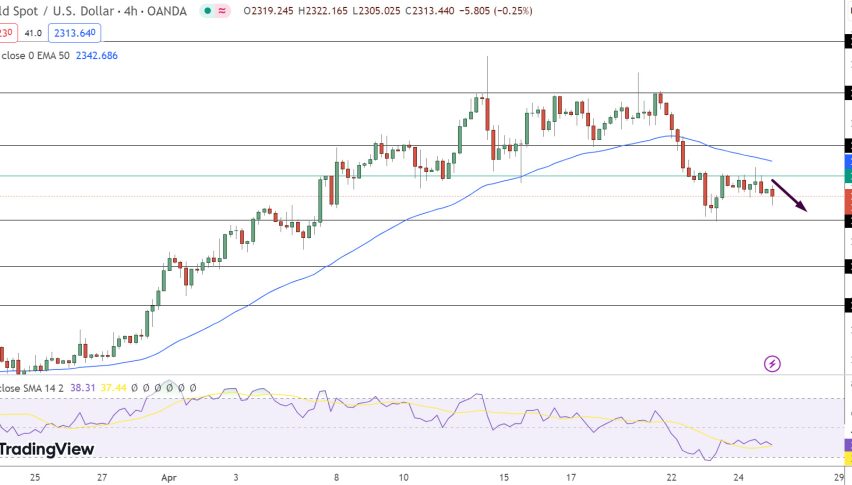
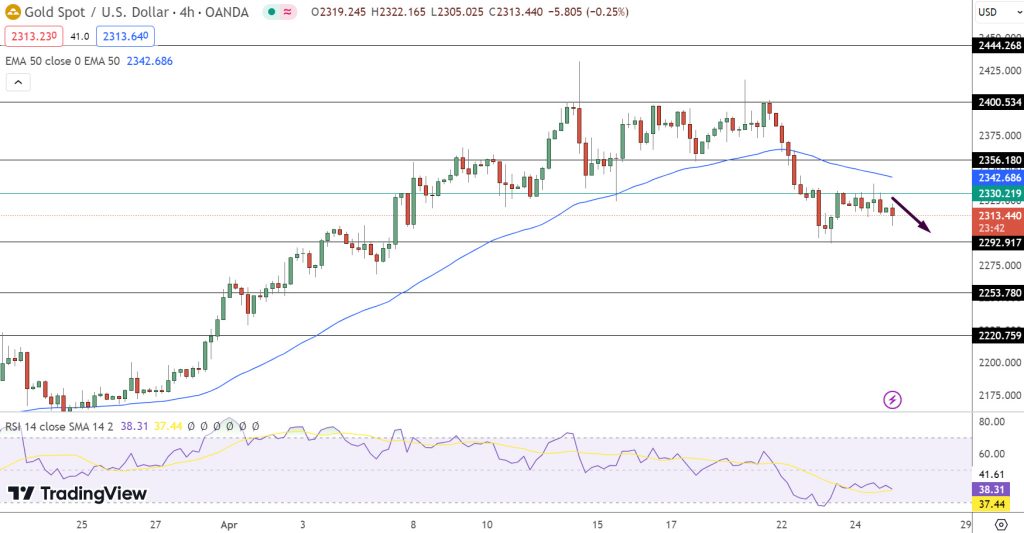
Currently, gold prices hover just below the pivotal $2332.535 level. Resistance levels to watch include $2346.215, $2359.266, and $2382.859, which could indicate further bullish momentum if breached.
On the downside, support is established at $2290.910, with additional levels at $2268.205 and $2244.573. These could act as critical thresholds that, if broken, may precipitate further declines.
The Relative Strength Index (RSI) is at 40, suggesting neutrality in market conditions, and providing room for price movement in either direction. The 50-day Exponential Moving Average (EMA) is at $2357.463, posing resistance above the current price level.
Investors might consider a prudent approach, such as setting a sell limit order at $2330 with a take profit at $2297 and a stop loss at $2345, to manage risks while capitalizing on possible downward trends in the gold market.
- Check out our free forex signals
- Follow the top economic events on FX Leaders economic calendar
- Trade better, discover more Forex Trading Strategies
- Open a FREE Trading Account
- Read our latest reviews on: Avatrade, Exness, HFM and XM
Related Articles


Sidebar rates
Related Posts
