Selling XAU at the 200 SMA As Gold Price Consolidation Continues
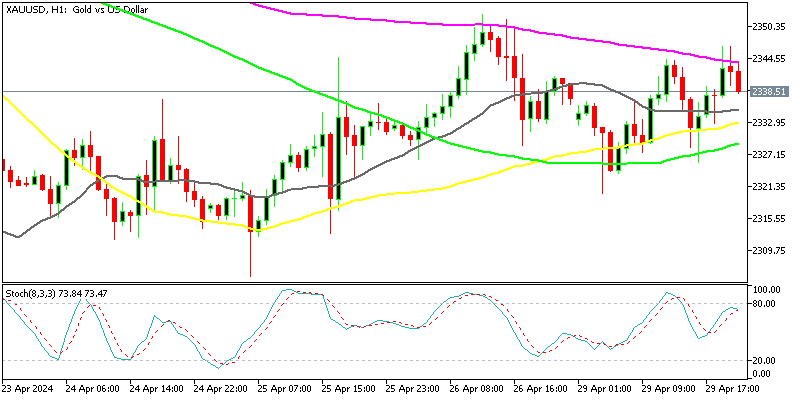
The price of Gold is bouncing between MAs on the H1 chart, which seems like a good range to trade, so we decided to sell Gold at the top.

The price of Gold is bouncing between MAs on the H1 chart, which seems like a good range to trade. Today, XAU is still trading inside the range, despite the huge volatility in JPY pairs after the BOJ intervention, which sent the JPY surging 600 pips higher and we decided to open a Gold sell signal below the 200 SMA.
Gold H1 Chart – Gold Stuck Between MA
Gold is currently consolidating between $2,310 and $2,350, as traders await the upcoming FOMC meeting on Wednesday. After a cooling off period last week which followed some huge demand, GOLD has been in consolidation mode over the past two weeks. Buyers have managed to keep prices in the range. However, this only represents a partial recovery from the drop seen on two weeks ago when XAU/USD was trading above $2,400.
On the chart, gold’s price is situated between the 200-hour Moving Average (MA) at the top (marked in purple) and the 50 SMA (Simple Moving Average) (yellow line) below. The 100-hour MA (green line) has recently acted as support at the bottom. This indicates a more neutral near-term bias, with traders adhering to these technical parameters.
The Buck is also exhibiting uncertainty, fluctuating after last week’s release of US Q1 GDP and PCE reports. Despite early gains this month, the USD is not making significant upward moves. The easing of geopolitical tensions contributed to lower demand for Gold and the USD.
Nonetheless, gold is still up for the month, which is noteworthy. In the short term, traders are competing, with sellers potentially gaining control if the price falls below the 100-hour moving average. However, they would need a significant push below $2,300 to assert dominance. A daily close below this level would be crucial in confirming any further downside movements, at least in the immediate term. For buyers, a break above the 200-hour moving average would shift the near-term bias back to bullish territory. This could prompt a retest of the $2,400 milestone.
Gold Live Chart
- Check out our free forex signals
- Follow the top economic events on FX Leaders economic calendar
- Trade better, discover more Forex Trading Strategies
- Open a FREE Trading Account
- Read our latest reviews on: Avatrade, Exness, HFM and XM
Related Articles


Sidebar rates
Related Posts
