Forex Signals Brief May 7: RBA and AUD Highlight the Day
Today the meeting from the Reserve Bank of Australia is the highlight of the day despite not changing interest rates

Yesterday markets were pretty quiet with little on the economic calendar. The primary economic highlight on yesterday’s calendar was the US employment trends for April. Despite the index dropping to its lowest level since May 2021, the market largely overlooked this data.

Additionally, there were speeches from two Fed officials: Richmond Fed President Barkin and New York Fed President Williams. Barkin seemed slightly more cautious on inflation and policy, but neither official suggested the need for a rate increase.
There were several geopolitical headlines when Israel’s invasion of Rafah became imminent. There was an agreement about a truce suggested by Middle Eastern neighboring countries. However, it was eventually revealed that the arrangement was rejected and the situation continues as before, however there was not much action in the markets after this news.
Today’s Market Expectations
Today started with the Retail Sales Monitor from the UK The UK Construction PMI for April will be released shortly, which is expected to remain little changed, with a slight improvement from 50.2 points to 50.4 points.
The RBA was widely anticipated to maintain the Cash Rate at 4.35%, but the potential for an unexpected rate hike cannot be disregarded. The latest inflation report came as a disappointment for those anticipating a rate cut in 2024, as Q1 CPI readings exceeded expectations by a significant margin. Consequently, the market pushed back the timing of the first rate cut further, now projecting it to occur in Q2 2025. The central bank has reiterated multiple times that the most effective contribution monetary policy can make to the welfare of Australians is to ensure that inflation returns to the target level within a reasonable timeframe.
Yesterday the volatility was low with not much on the economic calendar or in the news front, apart from some rumours that there might be a ceasefire in Palestine, but which didn’t materialize, leaving everything as it was. Risk sentiment remained mostly positive throughout the day, which sent USD/JPY higher where we had a sell signal, so we ended up with a losing signal.
Gold Falls to New Lows After the NFP
Gold prices had been consolidating above $2,300 for several days after dropping from above $2,400. Buyers kept prices within the range of $2,310 to $2,350. However, XAU has resumed its decline, falling below $2,300. The reduction in geopolitical tensions has alleviated risk sentiment in financial markets, leading to reduced demand for gold. Nevertheless, following yesterday’s Federal Open Market Committee (FOMC) meeting, gold prices once again surpassed $2,300. After the NFP we saw a surge higher but the price reversed bck down making a new low below the 200 SMA.
XAU/USD – Daily chart
EUR/USD Finding Resistance at MAs
EUR/USD dropped to a low of 1.06 approximately three weeks ago, then reversed and has been on an upward trend since. It surpassed the 1.07 threshold, signaling potential positive momentum. However, frequent rejection at 1.0750 indicates strong resistance in that area. Last week, the upward trend intensified, and on Friday, EUR/USD exceeded 1.08 in response to disappointing NFP data. However, buyers were unable to break through the 200 SMA (purple), and after briefly surpassing it, the price reversed downward, indicating a rejection.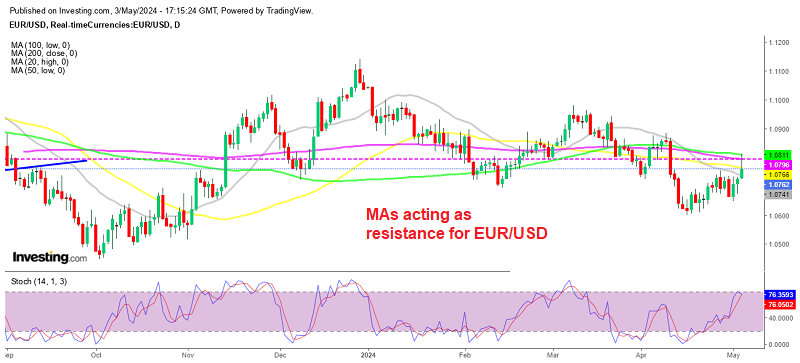
EUR/USD – Daily Chart
Cryptocurrency Update
Bitcoin Keeps Making Lower Highs
Bitcoin has dropped below $60,000 after rallying back to $68,000, marking its initial decline below this level. Presently, BTC is hovering near the 100 Simple Moving Average (SMA) (green line), which serves as a daily support level. Amidst the decline in BTC/USD, a buy signal was generated, anticipating a resurgence in the Bitcoin price to $70,000.
BTC/USD – Daily chart
The 100 SMA Turns into Resistance for Ethereum
Ethereum (ETH) dropped below $3,000, breaching the 100-day Simple Moving Average (SMA) on the daily chart. However, it later rebounded and rose back above $3,000. Despite significant gains, the upward momentum of buyers halted near the 50-day SMA (yellow line), leading to a reversal. Although the 100 SMA (green) was surpassed this week, the price remained in proximity to it.
ETH/USD – Daily chart
- Check out our free forex signals
- Follow the top economic events on FX Leaders economic calendar
- Trade better, discover more Forex Trading Strategies
- Open a FREE Trading Account
- Read our latest reviews on: Avatrade, Exness, HFM and XM
Related Articles


Sidebar rates
Related Posts
