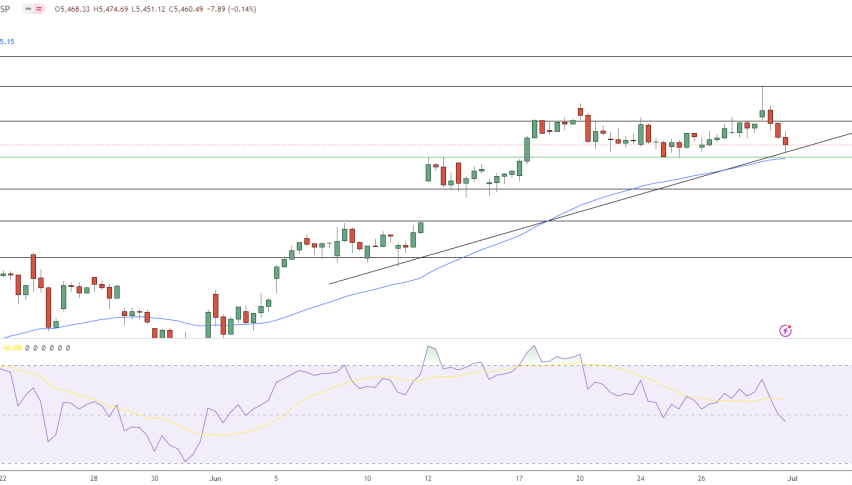
S&P 500 (SPX), Nasdaq Composite (IXIC), and DJIA (US30) Set For A New ATH?
Based on the recent technical analysis, the S&P 500 (SPX), DJIA (US30), and Nasdaq Composite Index (IXIC) are poised for potential new all-time highs, contingent on the closure of this month’s trading candle.
S&P500 (SPX) Recovered By More than 5 %
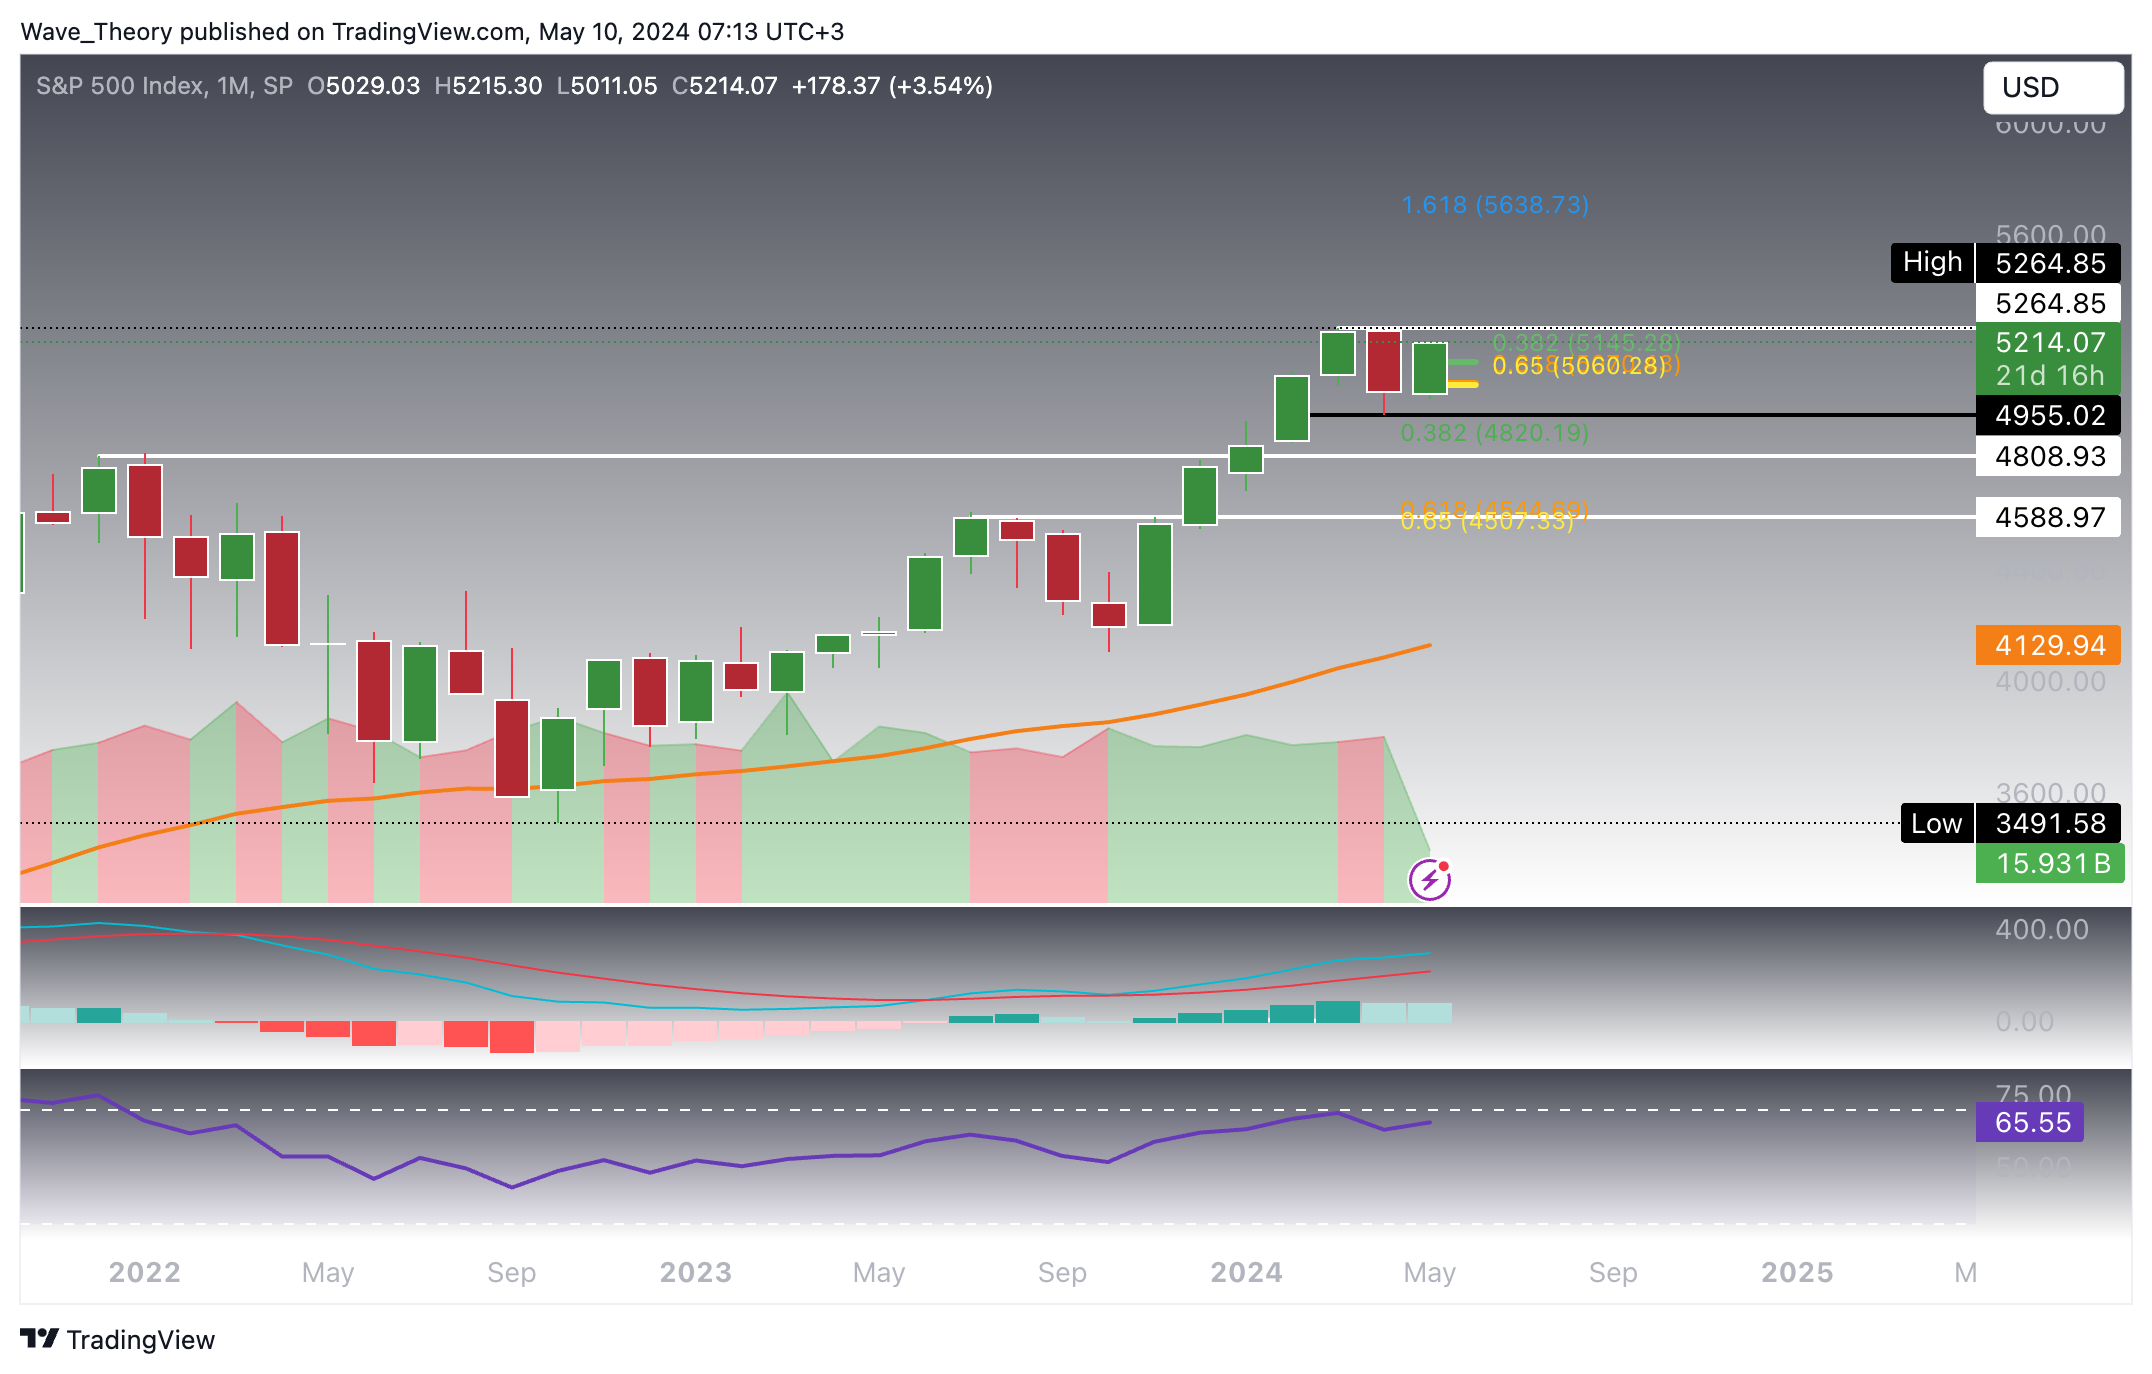
After a brief correction, the SPX rebounded from a local low of 4,946, surging nearly 5.3% and breaking through the golden ratio resistance at 5,155. This bullish breakout positions the SPX to potentially test its all-time high at 5,265. The MACD lines have crossed bullishly and the histogram indicates a continuing bullish trend, though the RSI remains neutral.
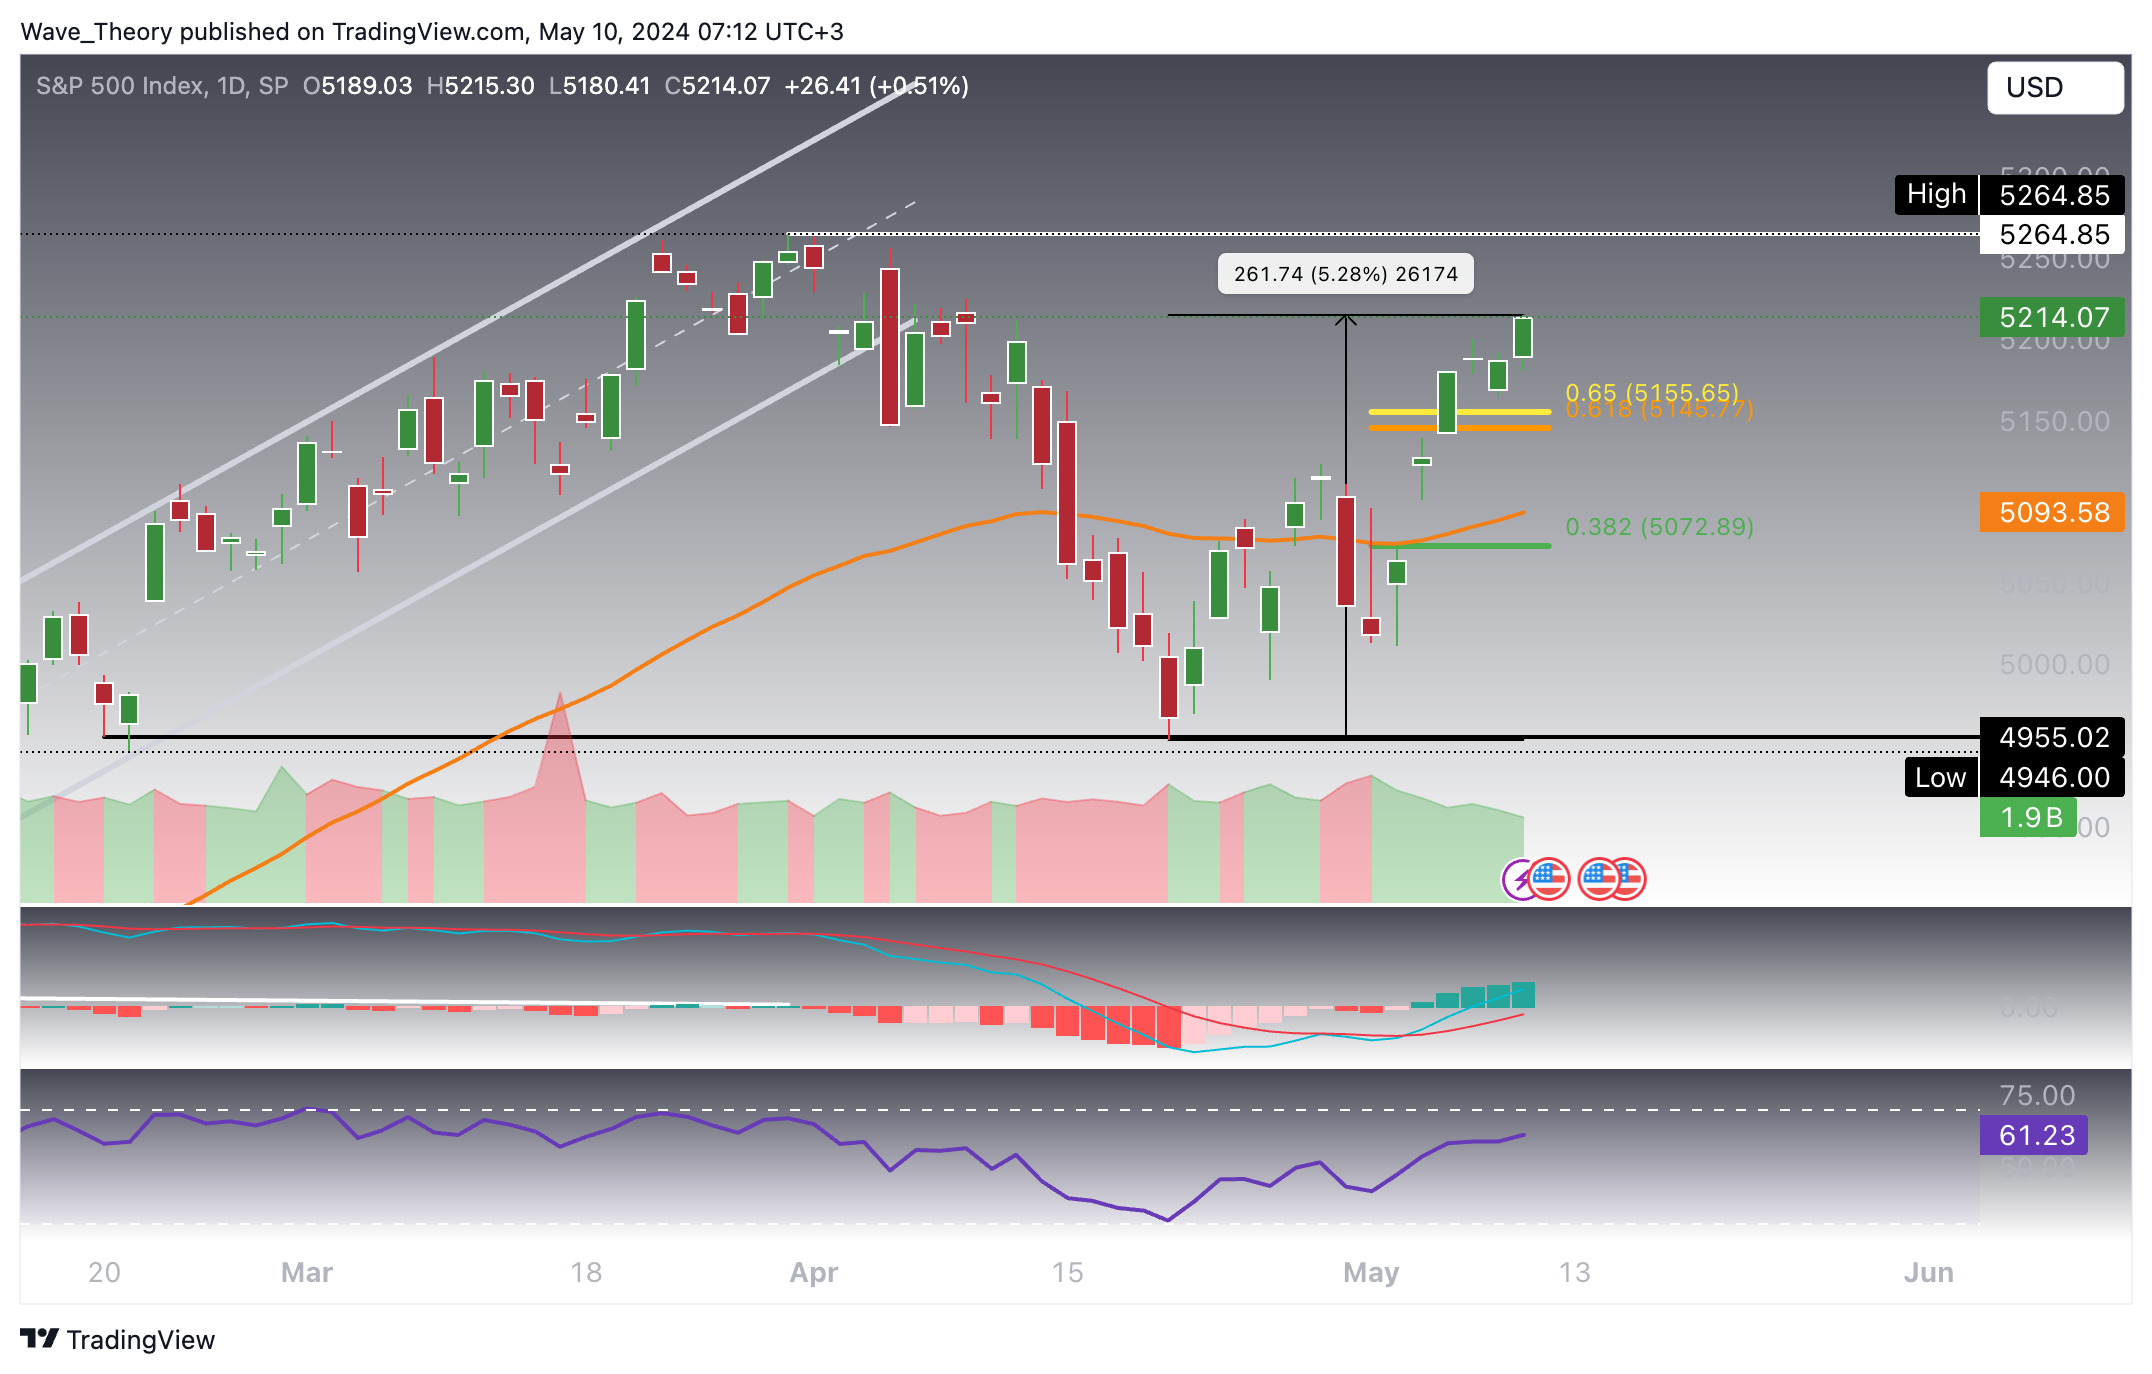
Indicators are bullish as evidenced by a golden crossover in the EMAs, confirming a short-term bullish trend. The MACD lines remain bullish, however, the RSI is approaching overbought territory, and the MACD histogram is trending lower.
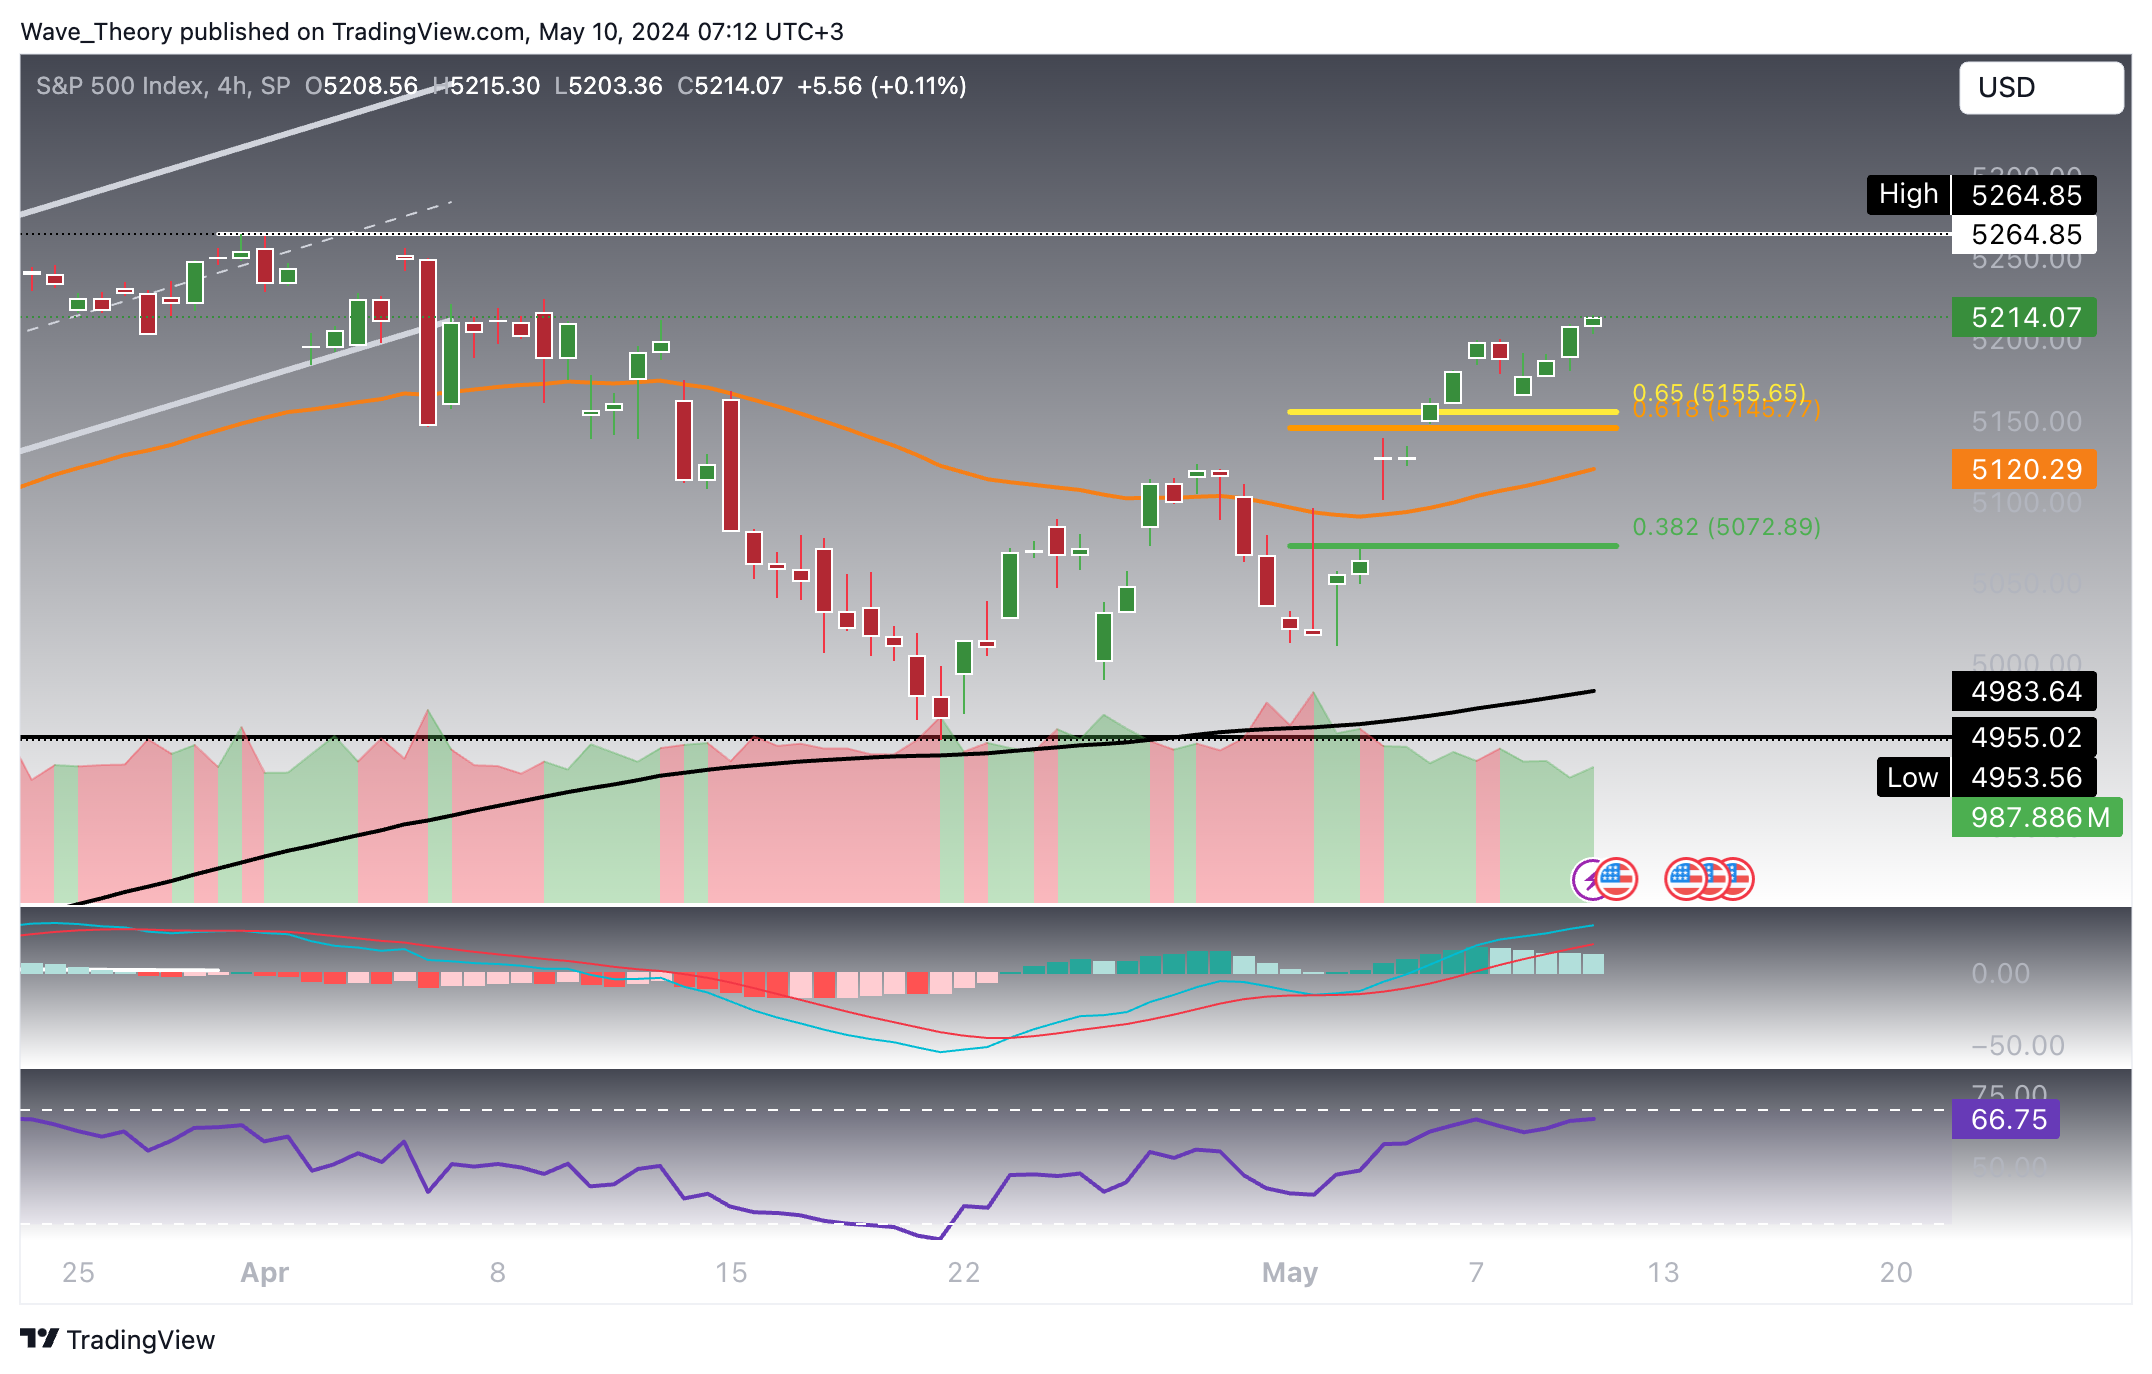
The MACD histogram has started to tick upwards bullishly, although the MACD lines are still crossed bearishly. The RSI is neutral but approaching overbought areas.
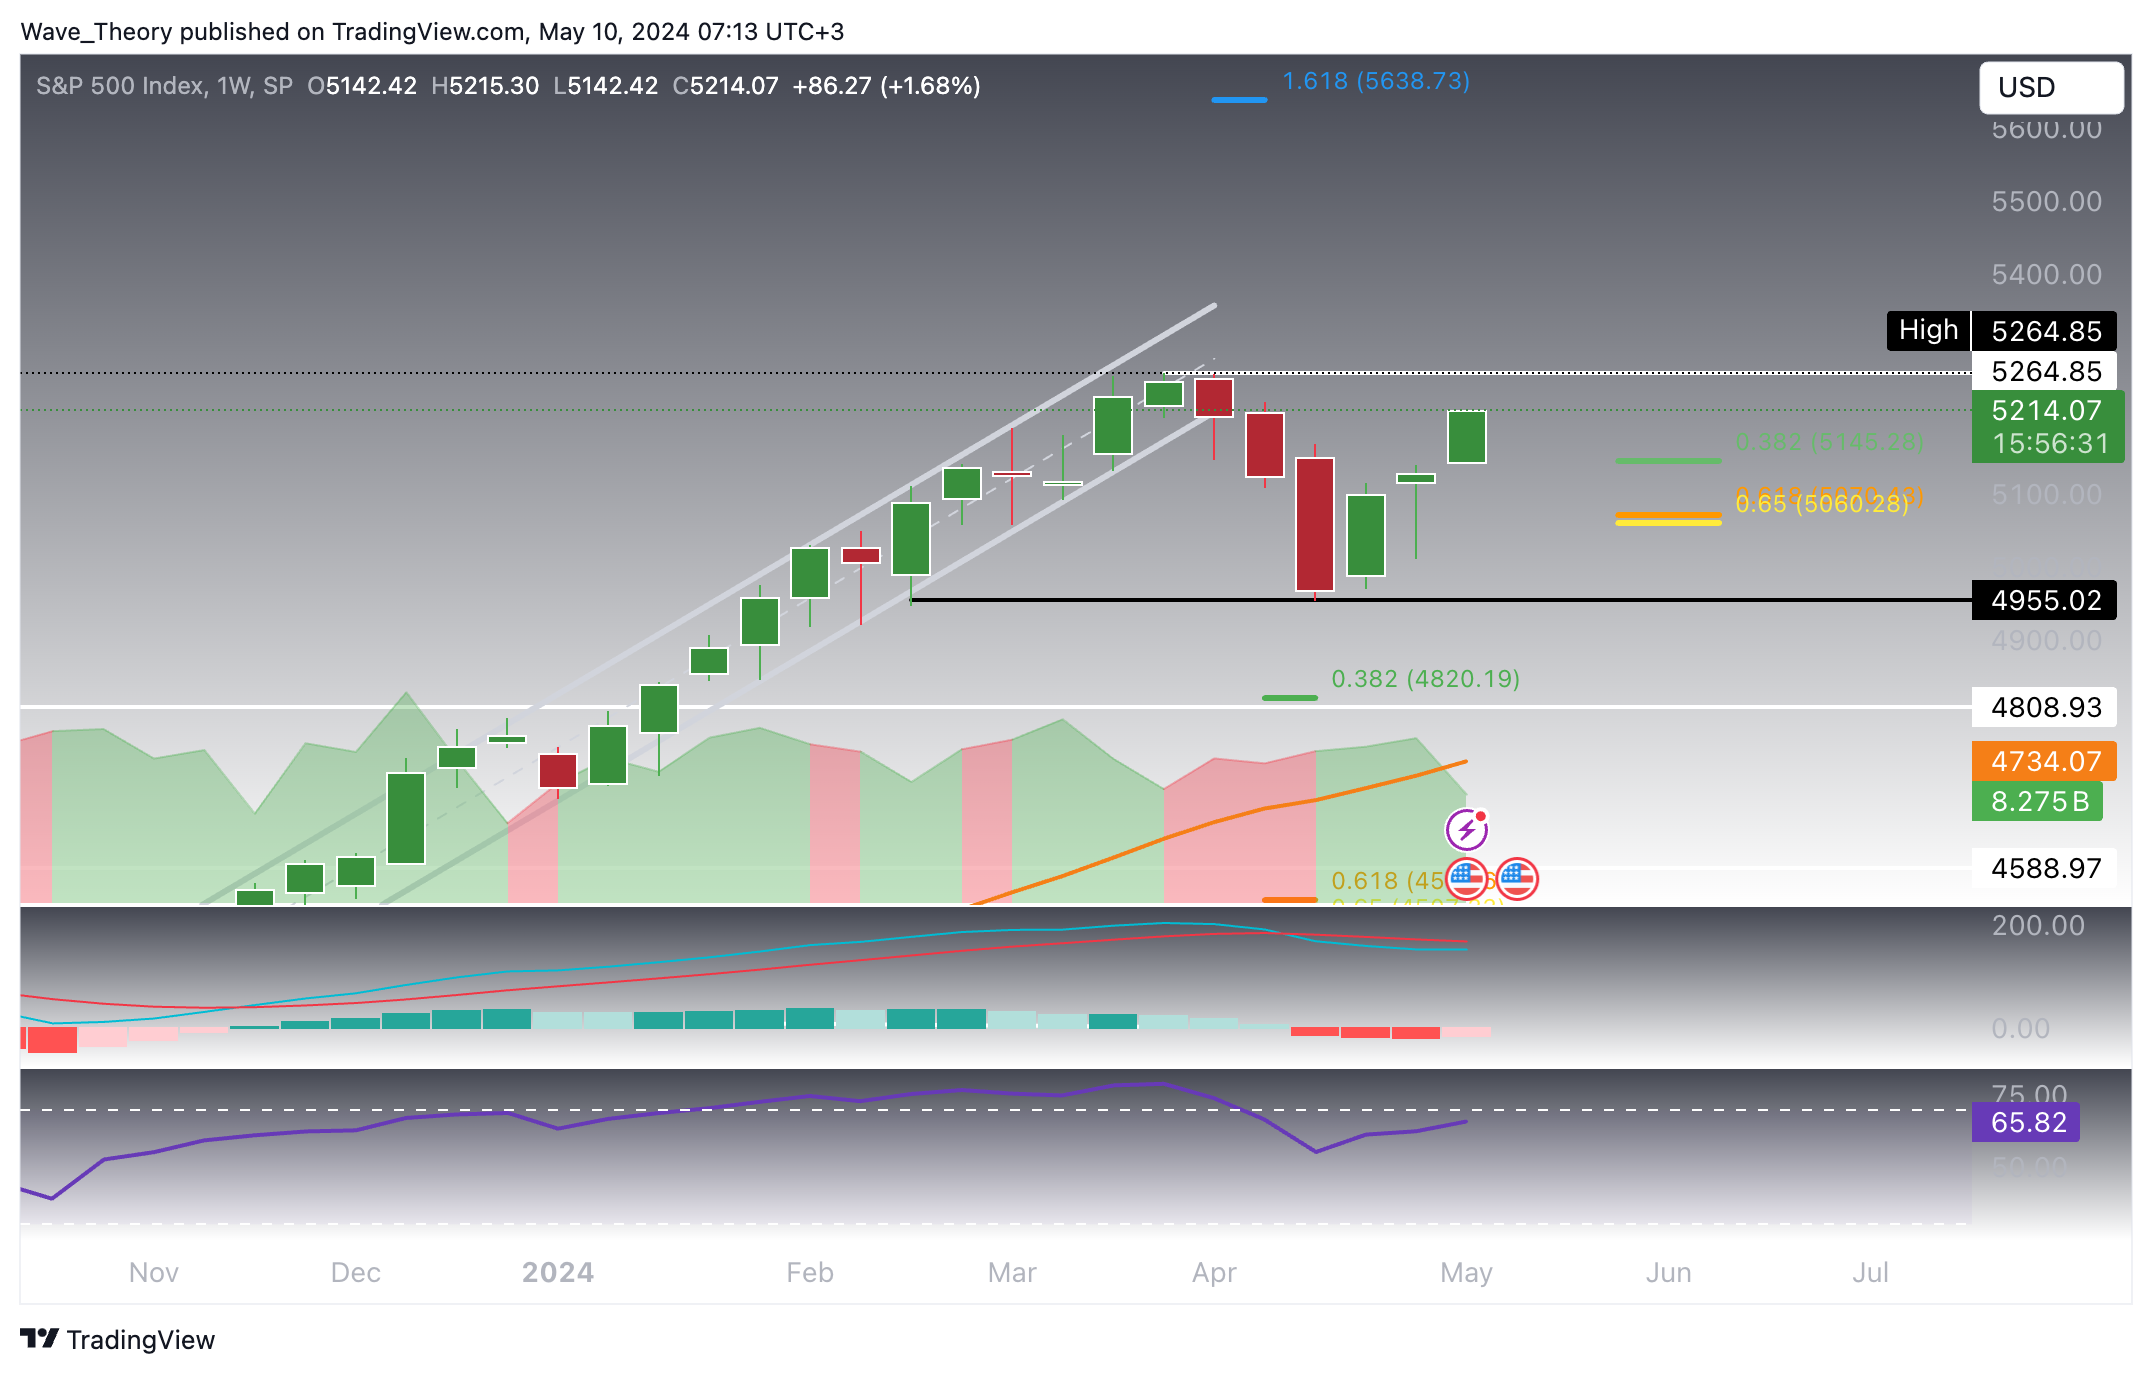
Should the SPX close above 5,258, a bullish engulfing candle could form, setting the stage for a move towards a new all-time high and potentially reaching the 1.618 Fibonacci projection level.
DJI (US30) Is Also Approaching Its ATH
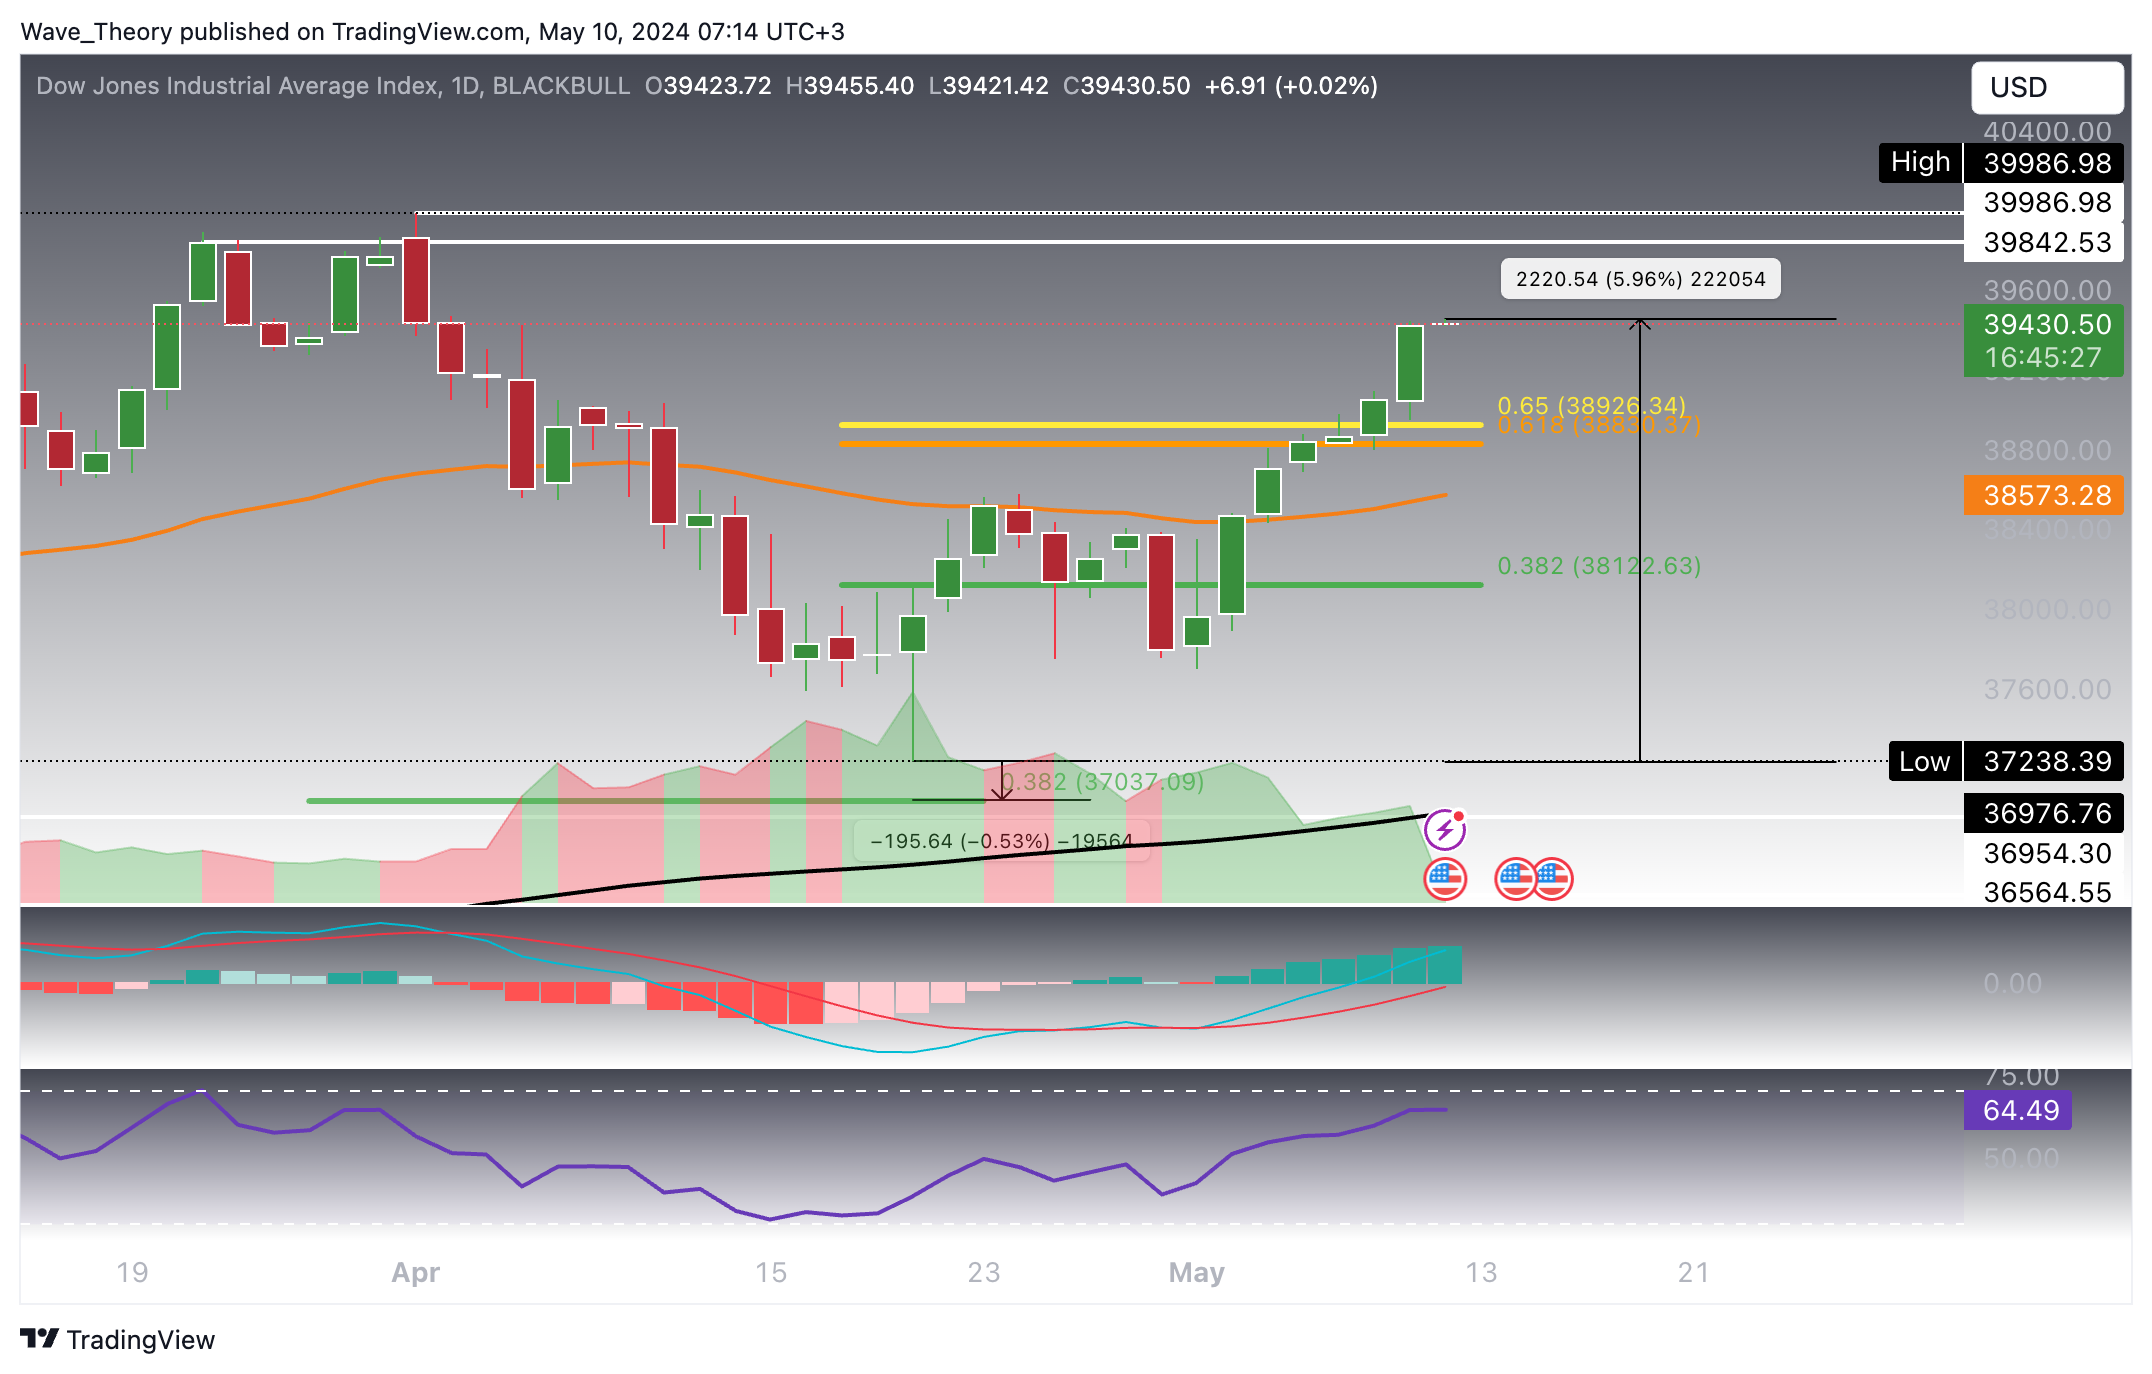
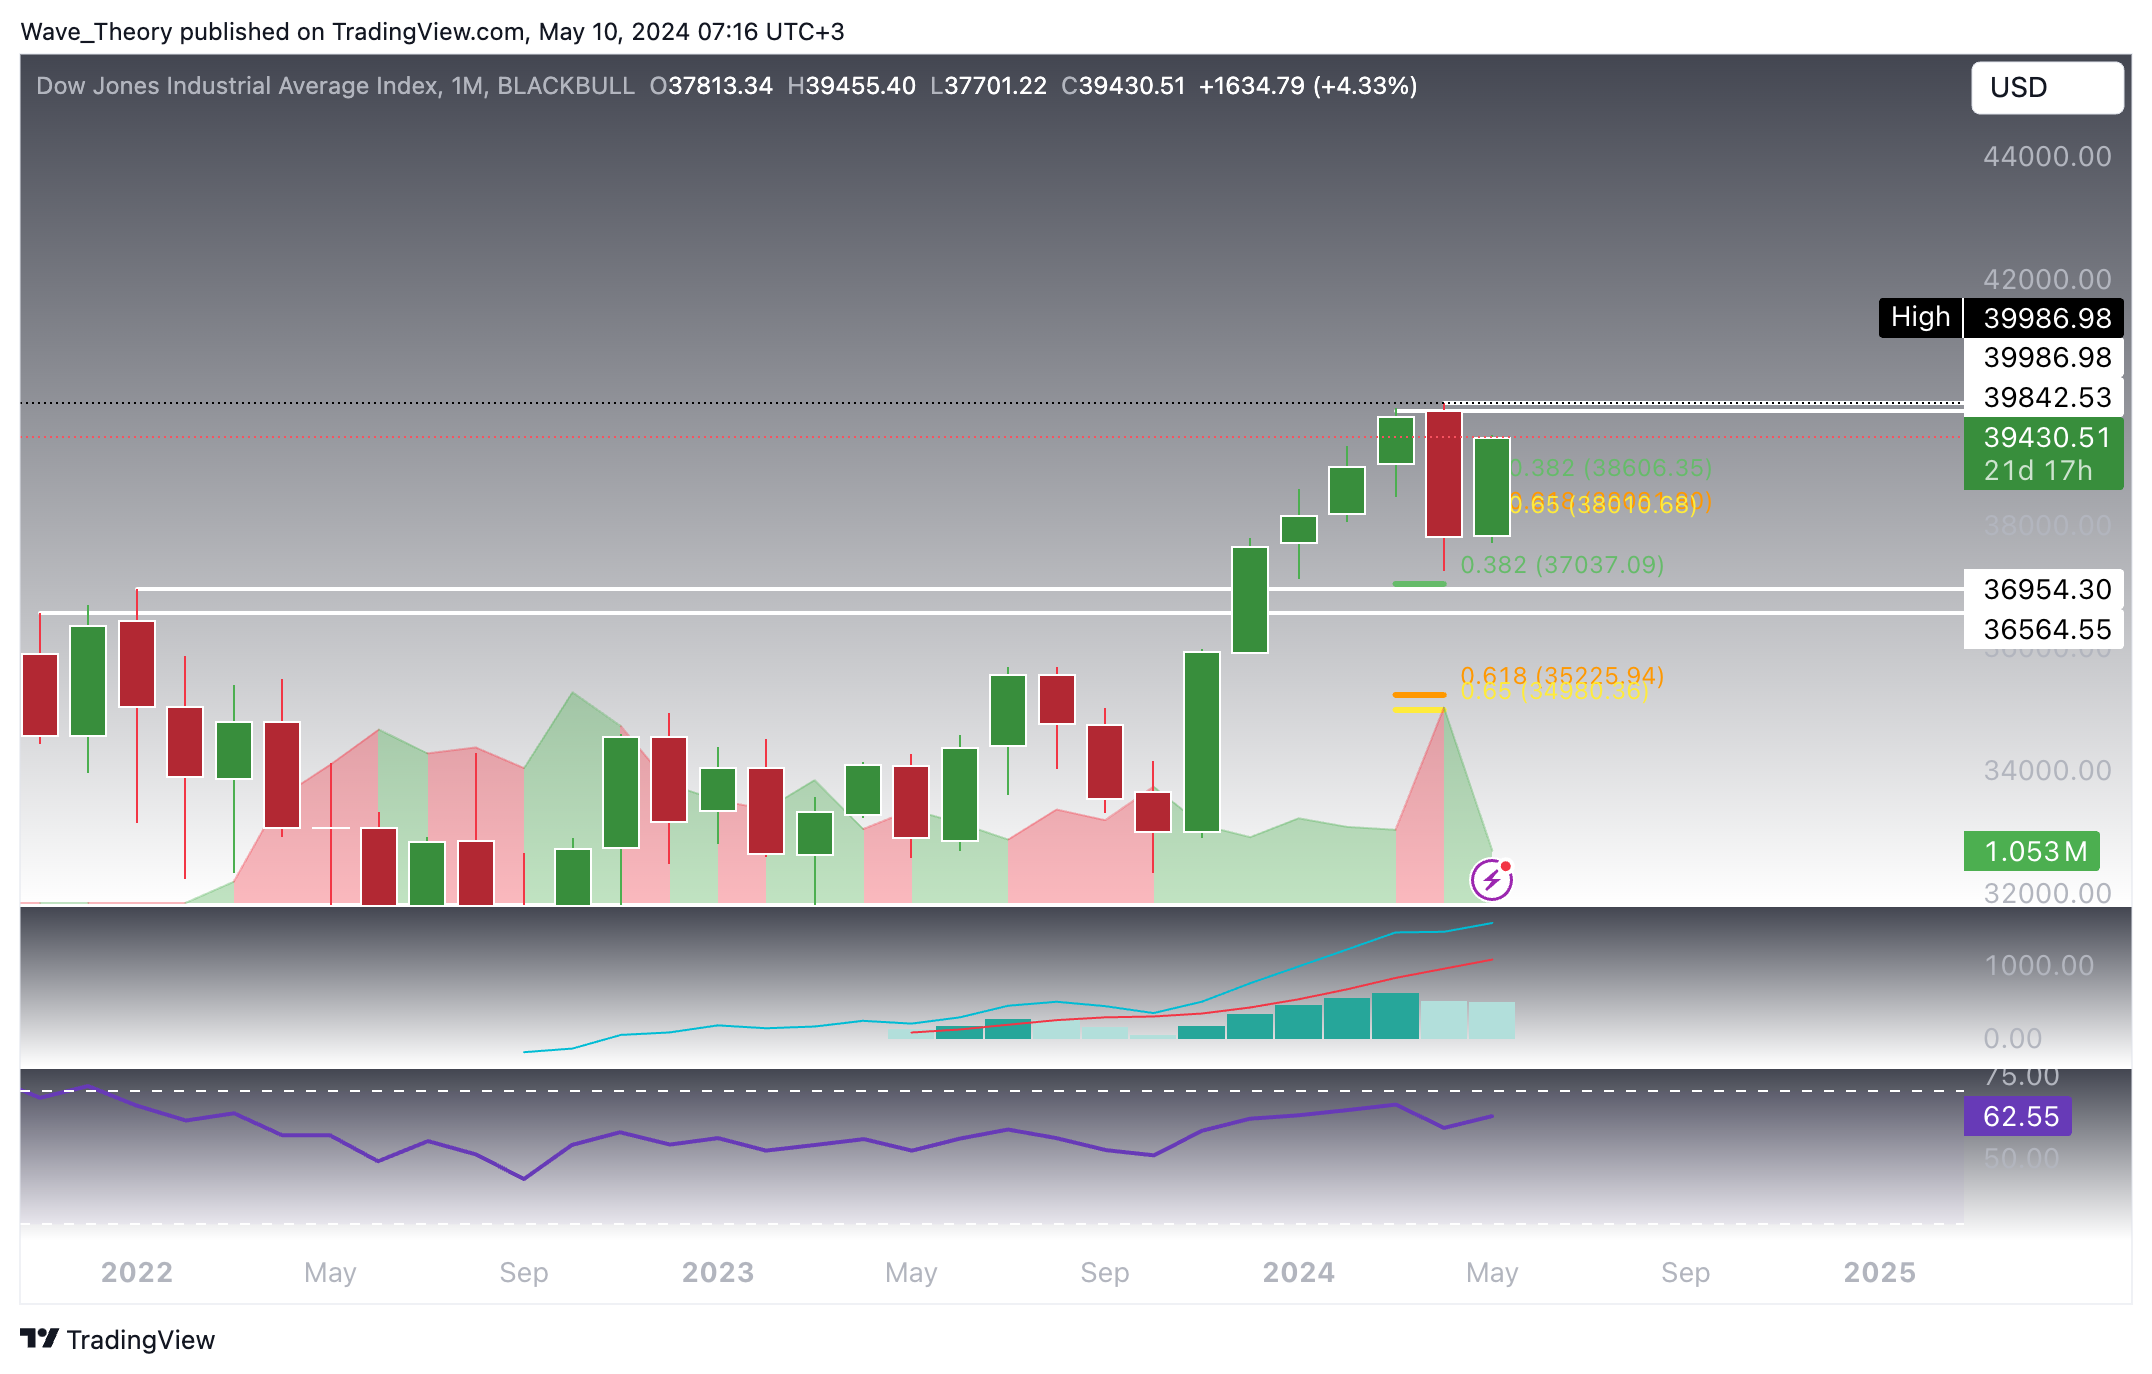
The DJIA has surged nearly 6%, decisively breaking the golden ratio resistance at 39,925. The daily indicators are bullish with a golden crossover in the EMAs and a bullish MACD. The RSI gives no clear directional signals.
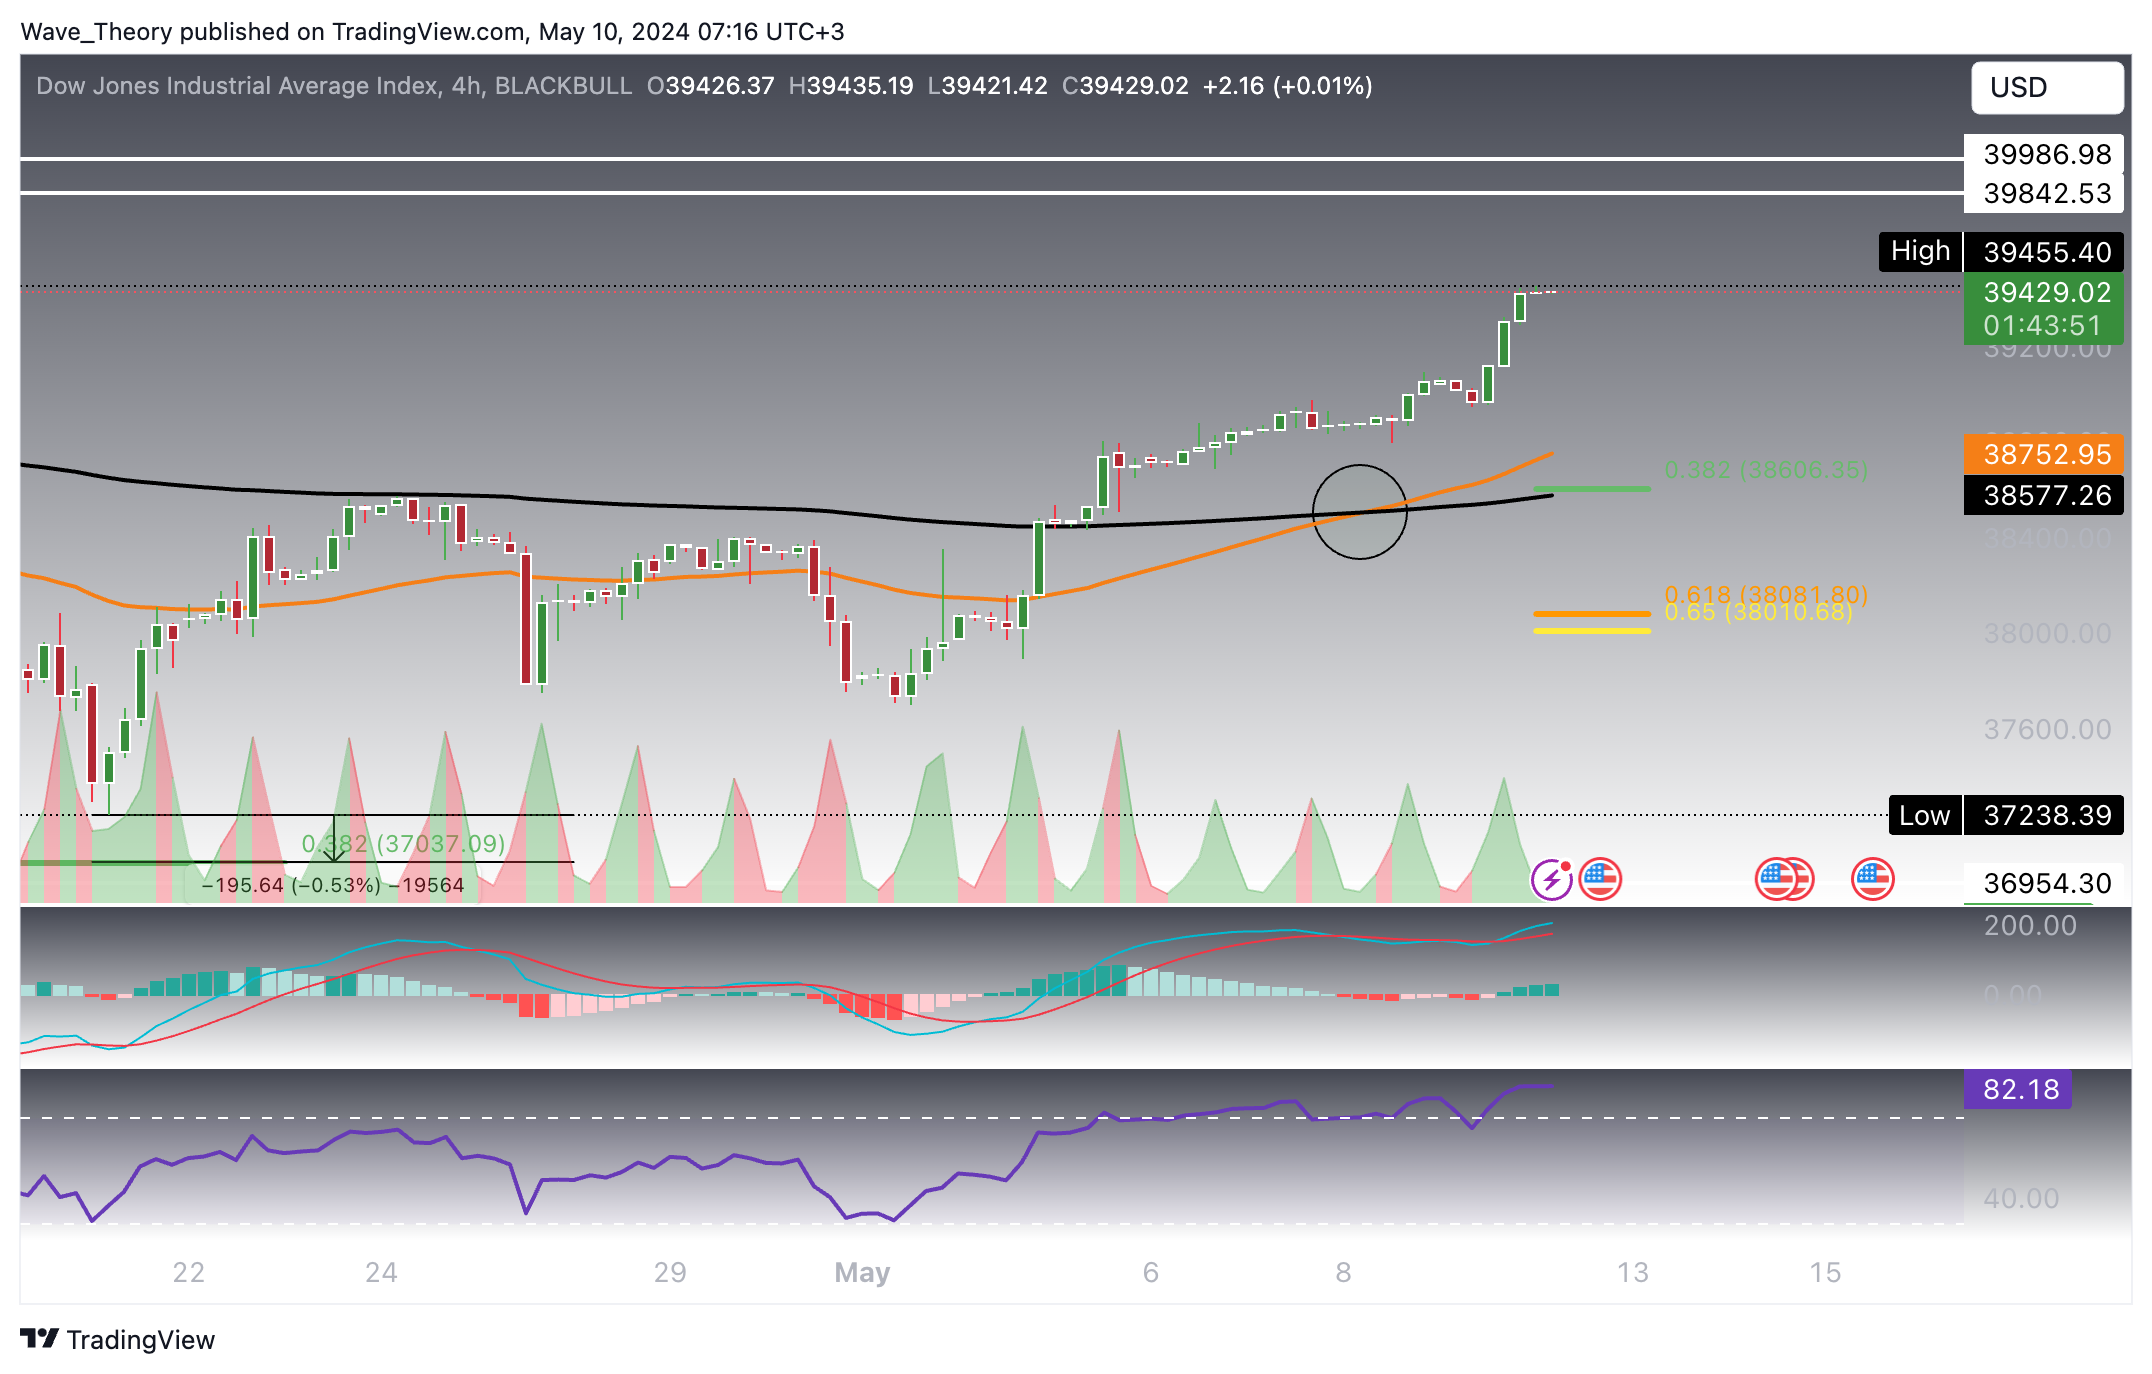
In the 4H-chart, the EMAs have formed a bullish crossover, with the MACD also showing clear bullish signs. The RSI is in overbought territory, yet without bearish divergence, suggesting continued bullish momentum.
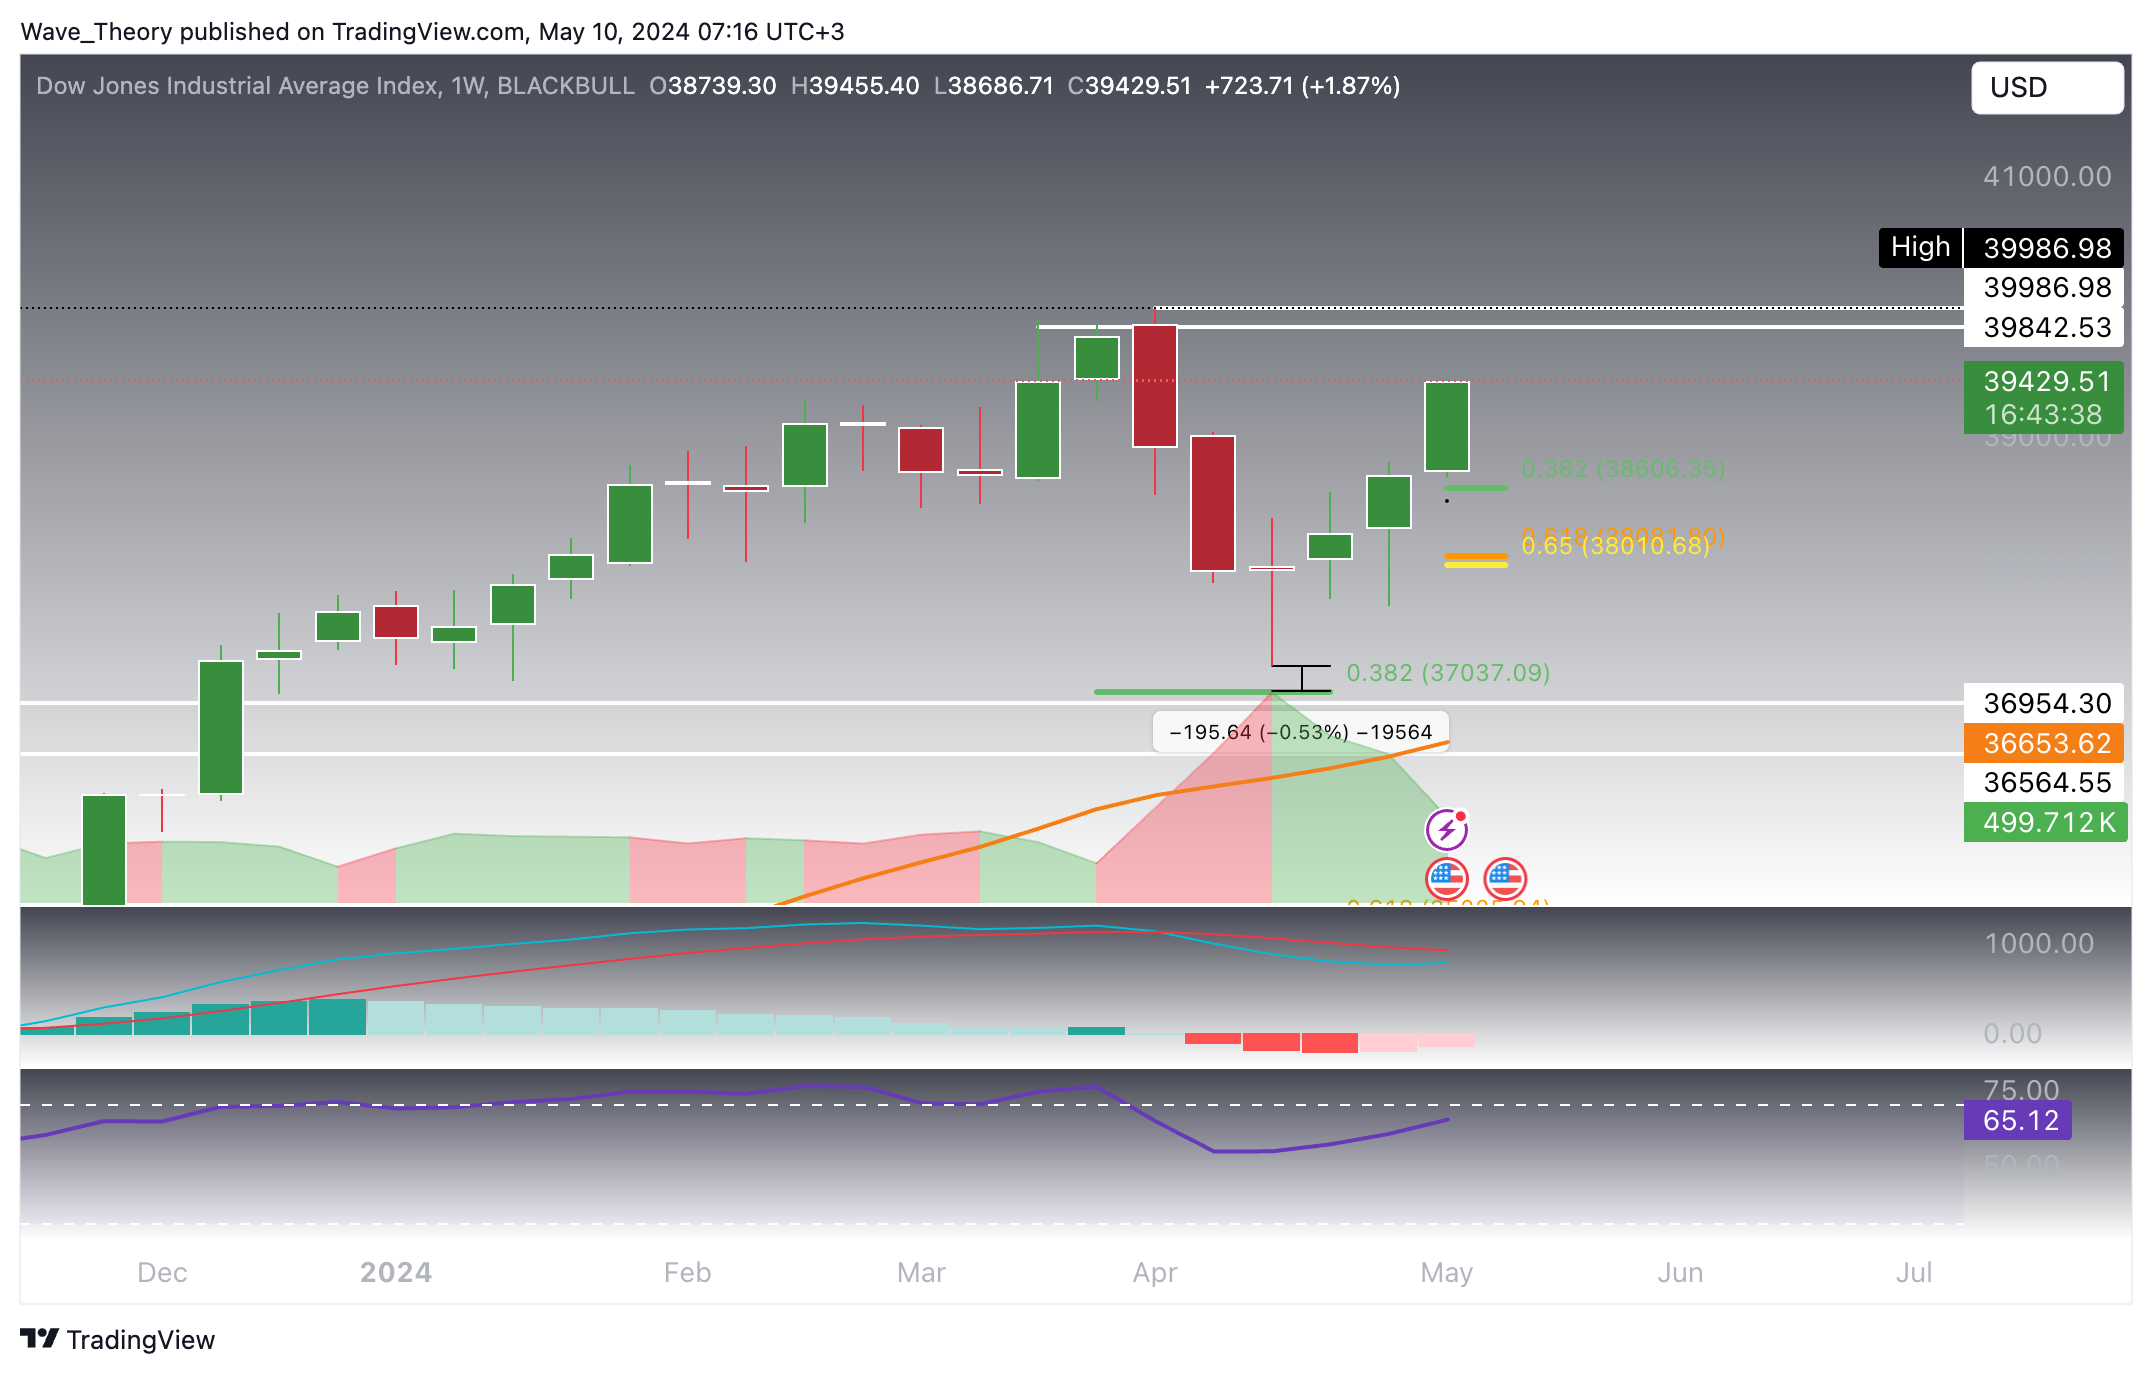
In the weekly chart the MACD histogram is ticking bullishly higher for the last two weeks, though the MACD lines remain bearishly crossed. The RSI is neutral.
In the monthly chart, the histogram of the MACD has been bullish since last month, and the MACD lines have crossed bullishly. Although the DJIA cannot form a bullish engulfing candle this month, it is poised to possibly reach or surpass its ATH soon.
Will Nasdaq Composite Index (IXIC) Reach Its ATH Soon?
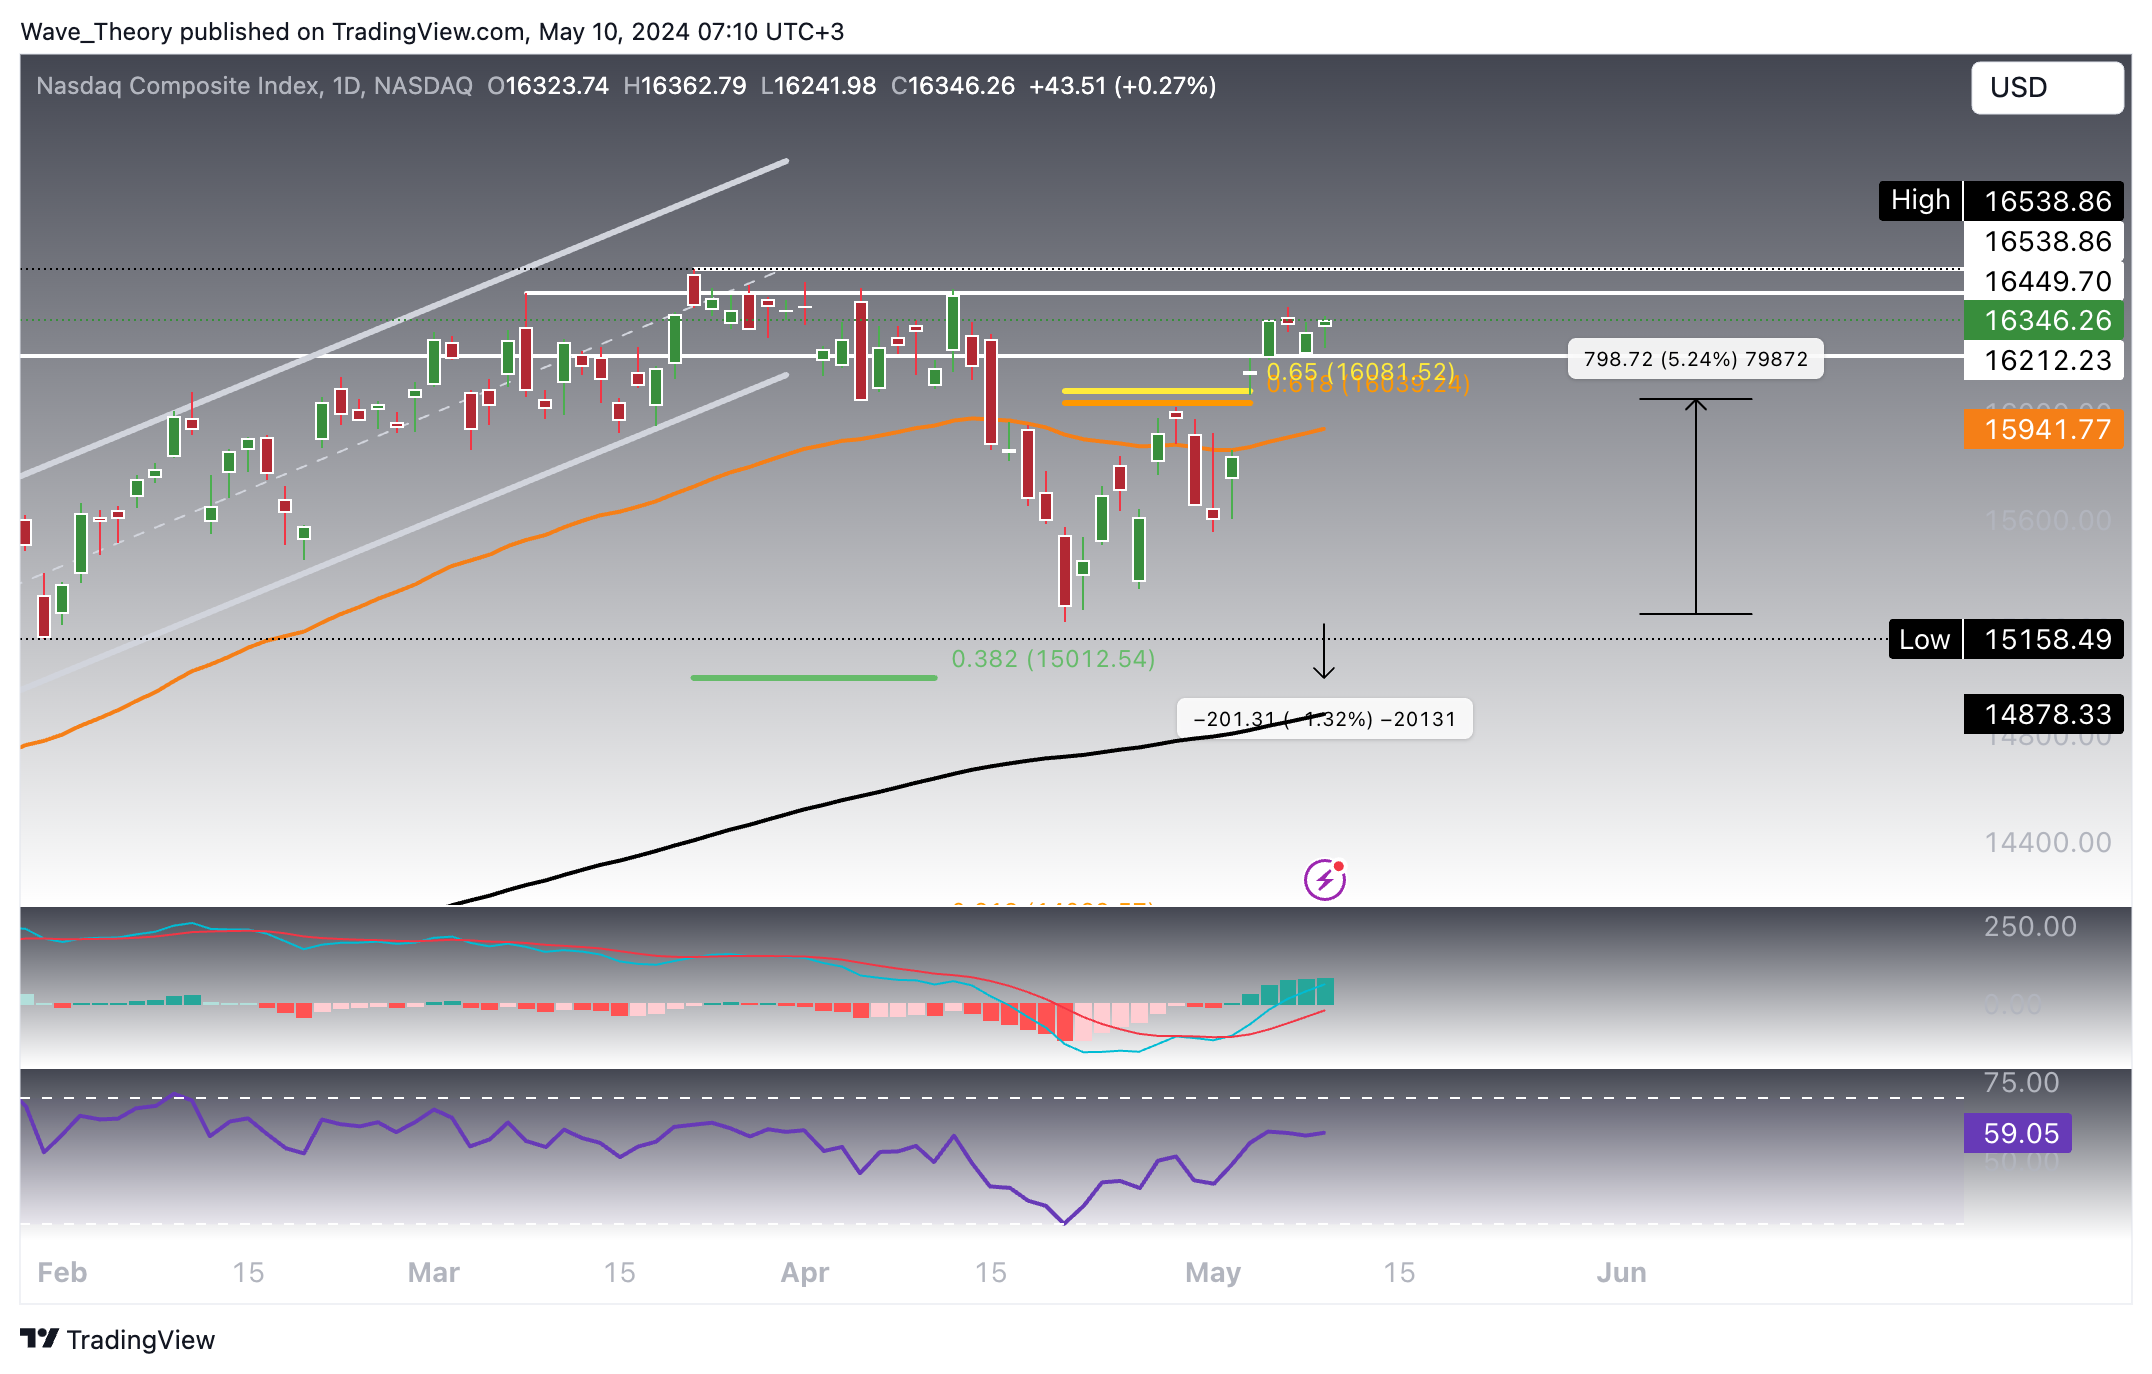
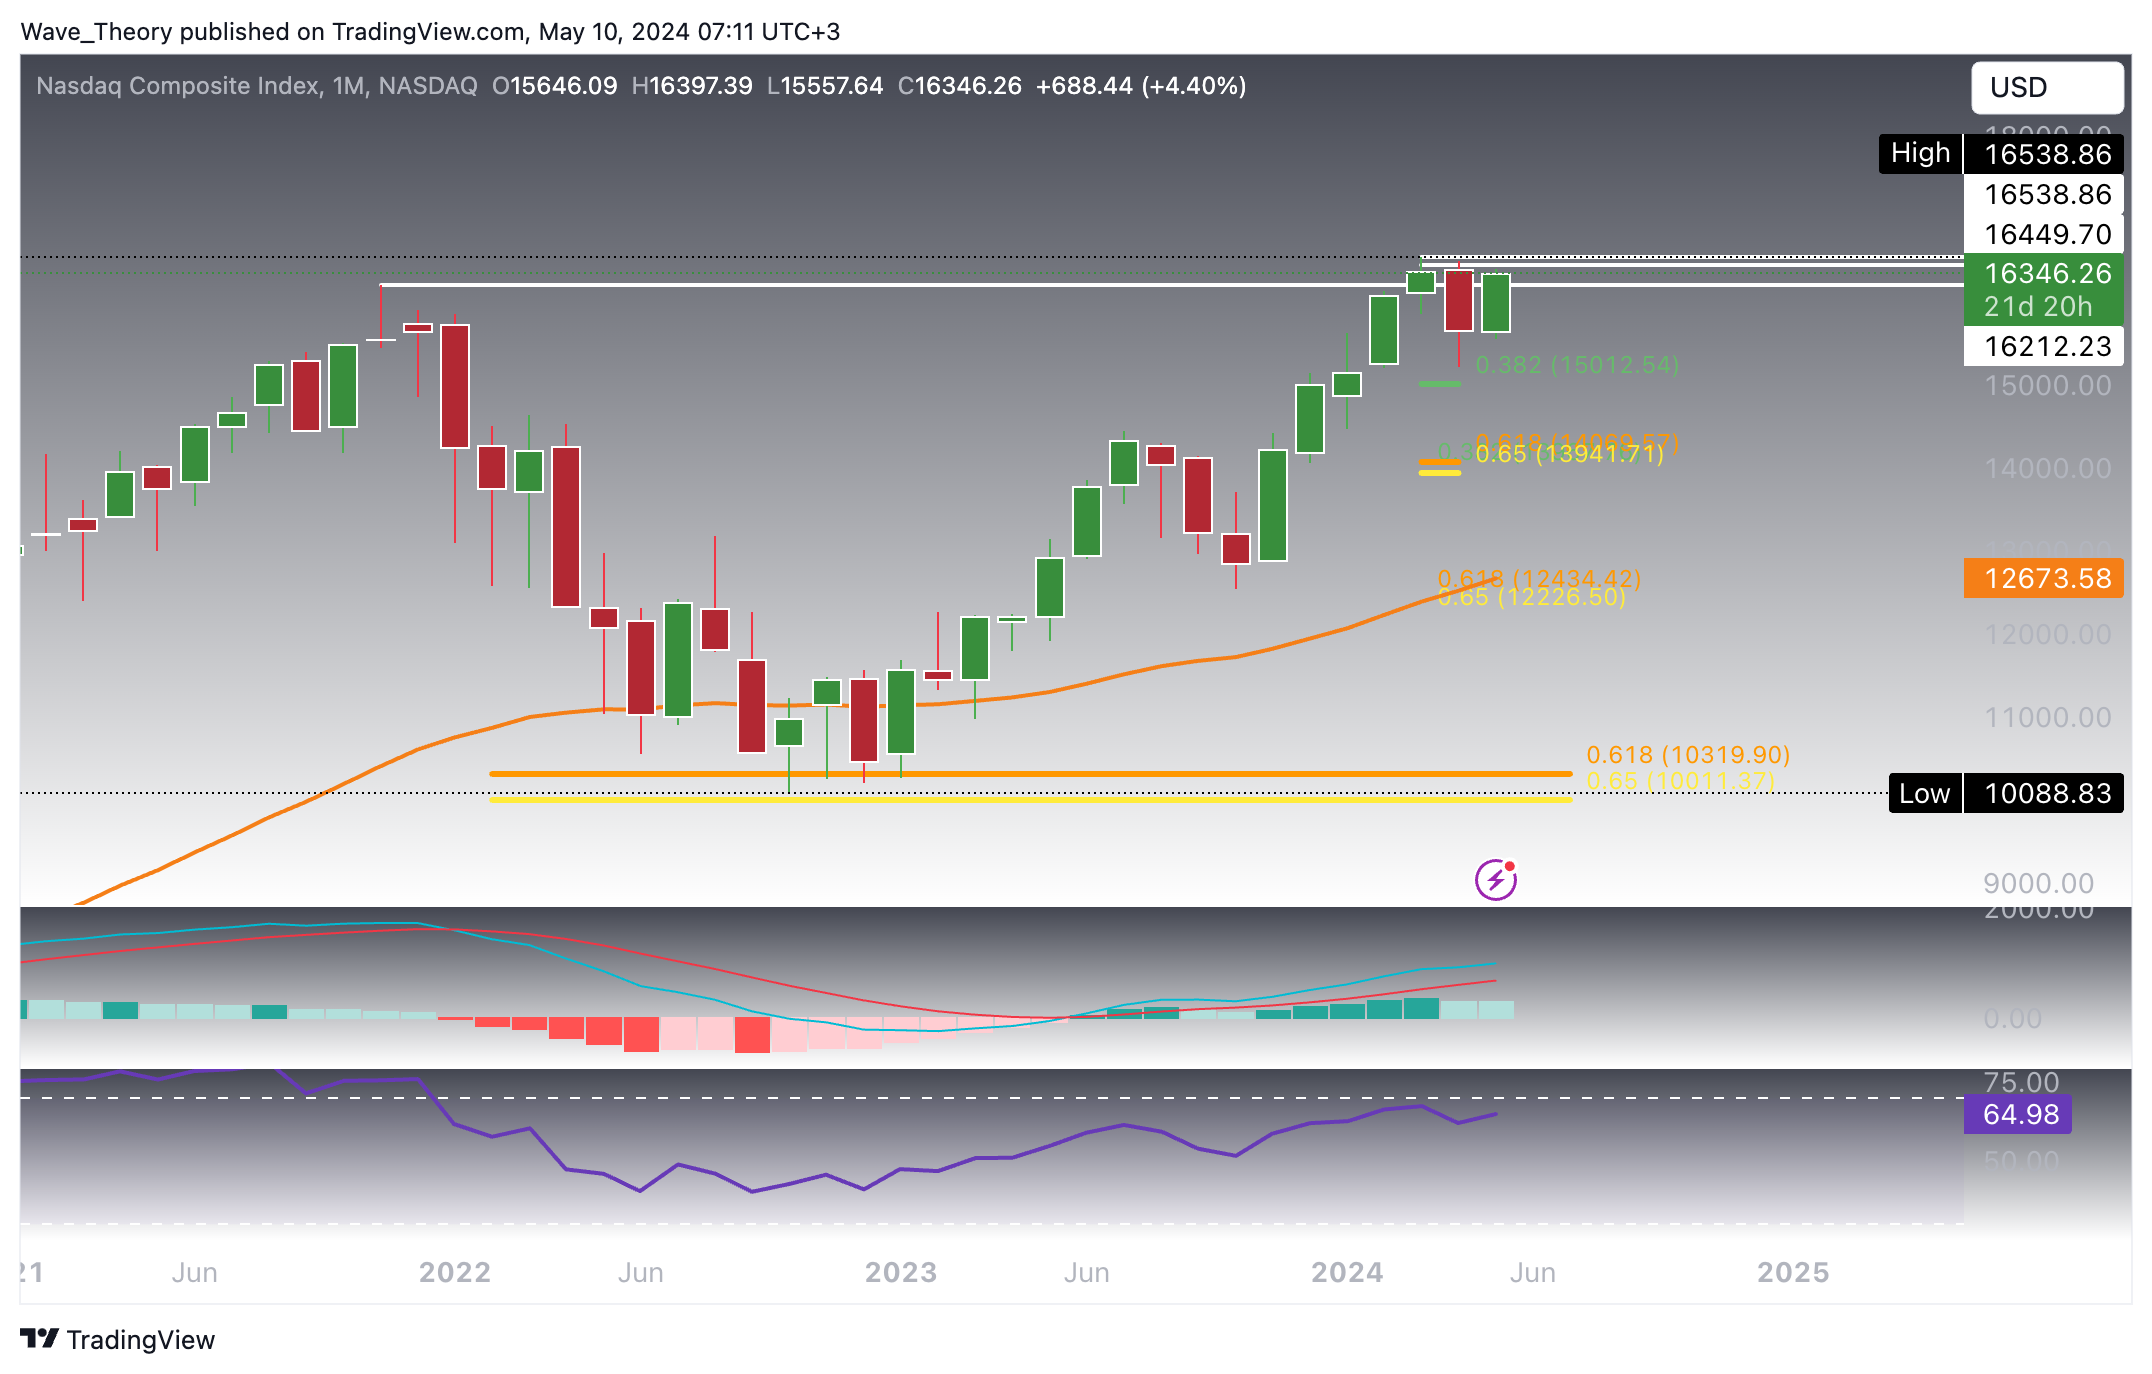
The Nasdaq Composite Index (IXIC) is not far away from reaching its ath. After missing the 0.382 fib support target of 15,013 by 1,3 %, it surged to the golden ratio resistance at 16,039 where it faced rejection. Shortly after however, it broke the resistance bullishly.
It now faces significant resistance between 16,450 and 16,539. The daily chart indicators are bullish with a confirmation of the bullish trend by the EMAs and both bullish MACD lines and histogram. The RSI remains neutral.
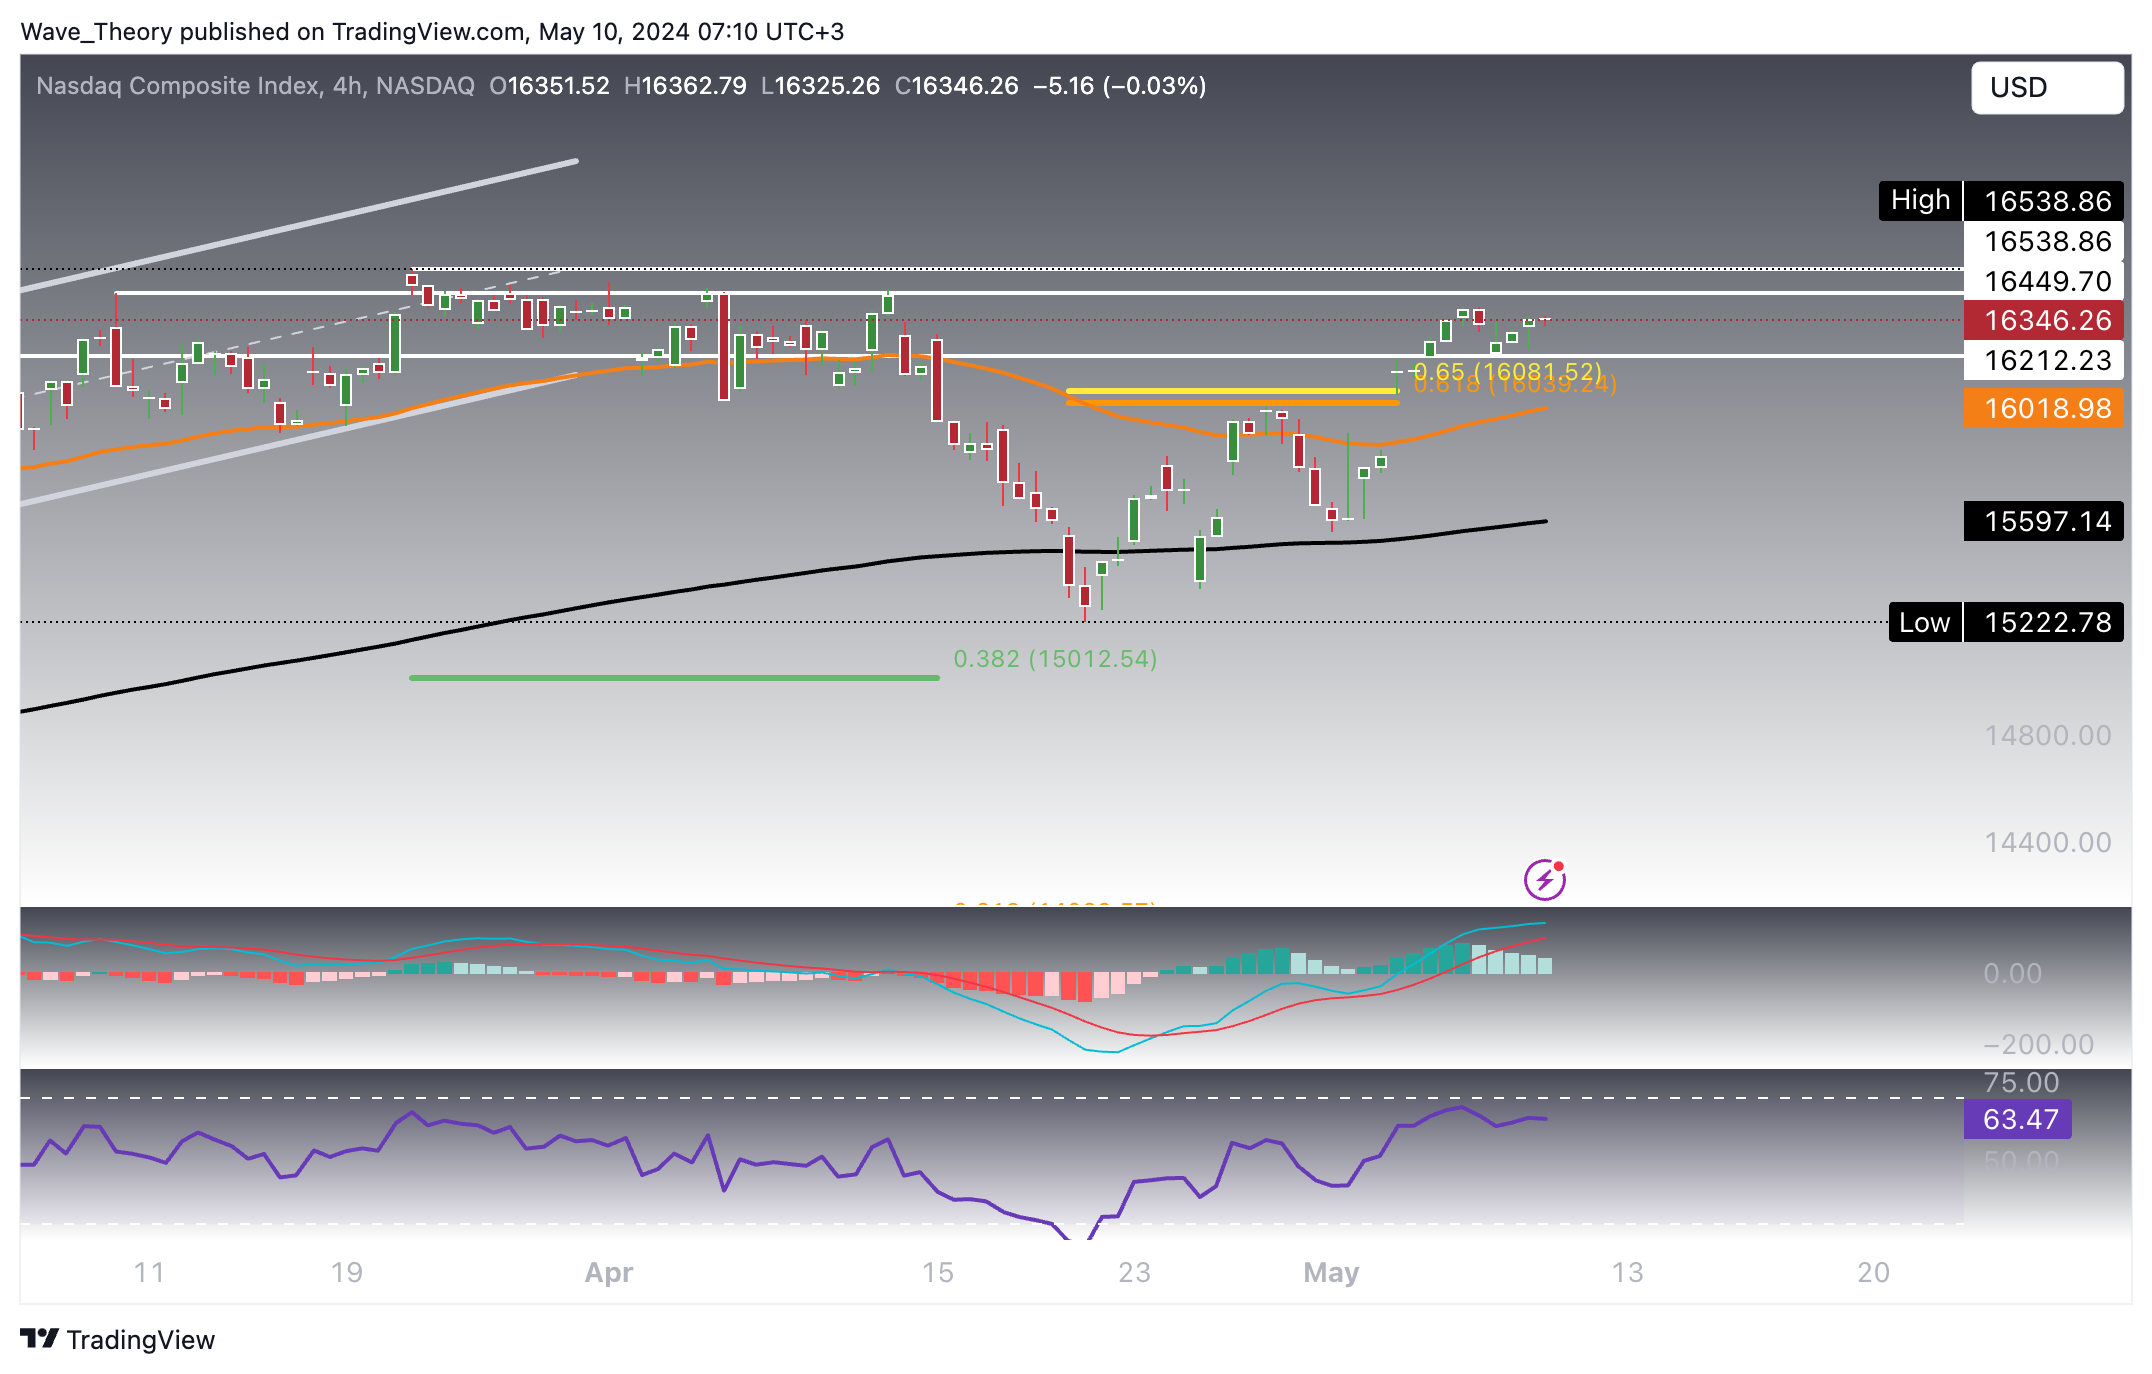
In the 4H-chart, indicators continue to be bullish with positive EMAs and MACD lines. The RSI is neutral, but the MACD histogram trends lower.
After a considerable drop four weeks ago, the recovery of roughly 7.5 % has led to a bullish tick in the MACD histogram since last week, though the MACD lines are still bearishly crossed and the RSI is neutral.
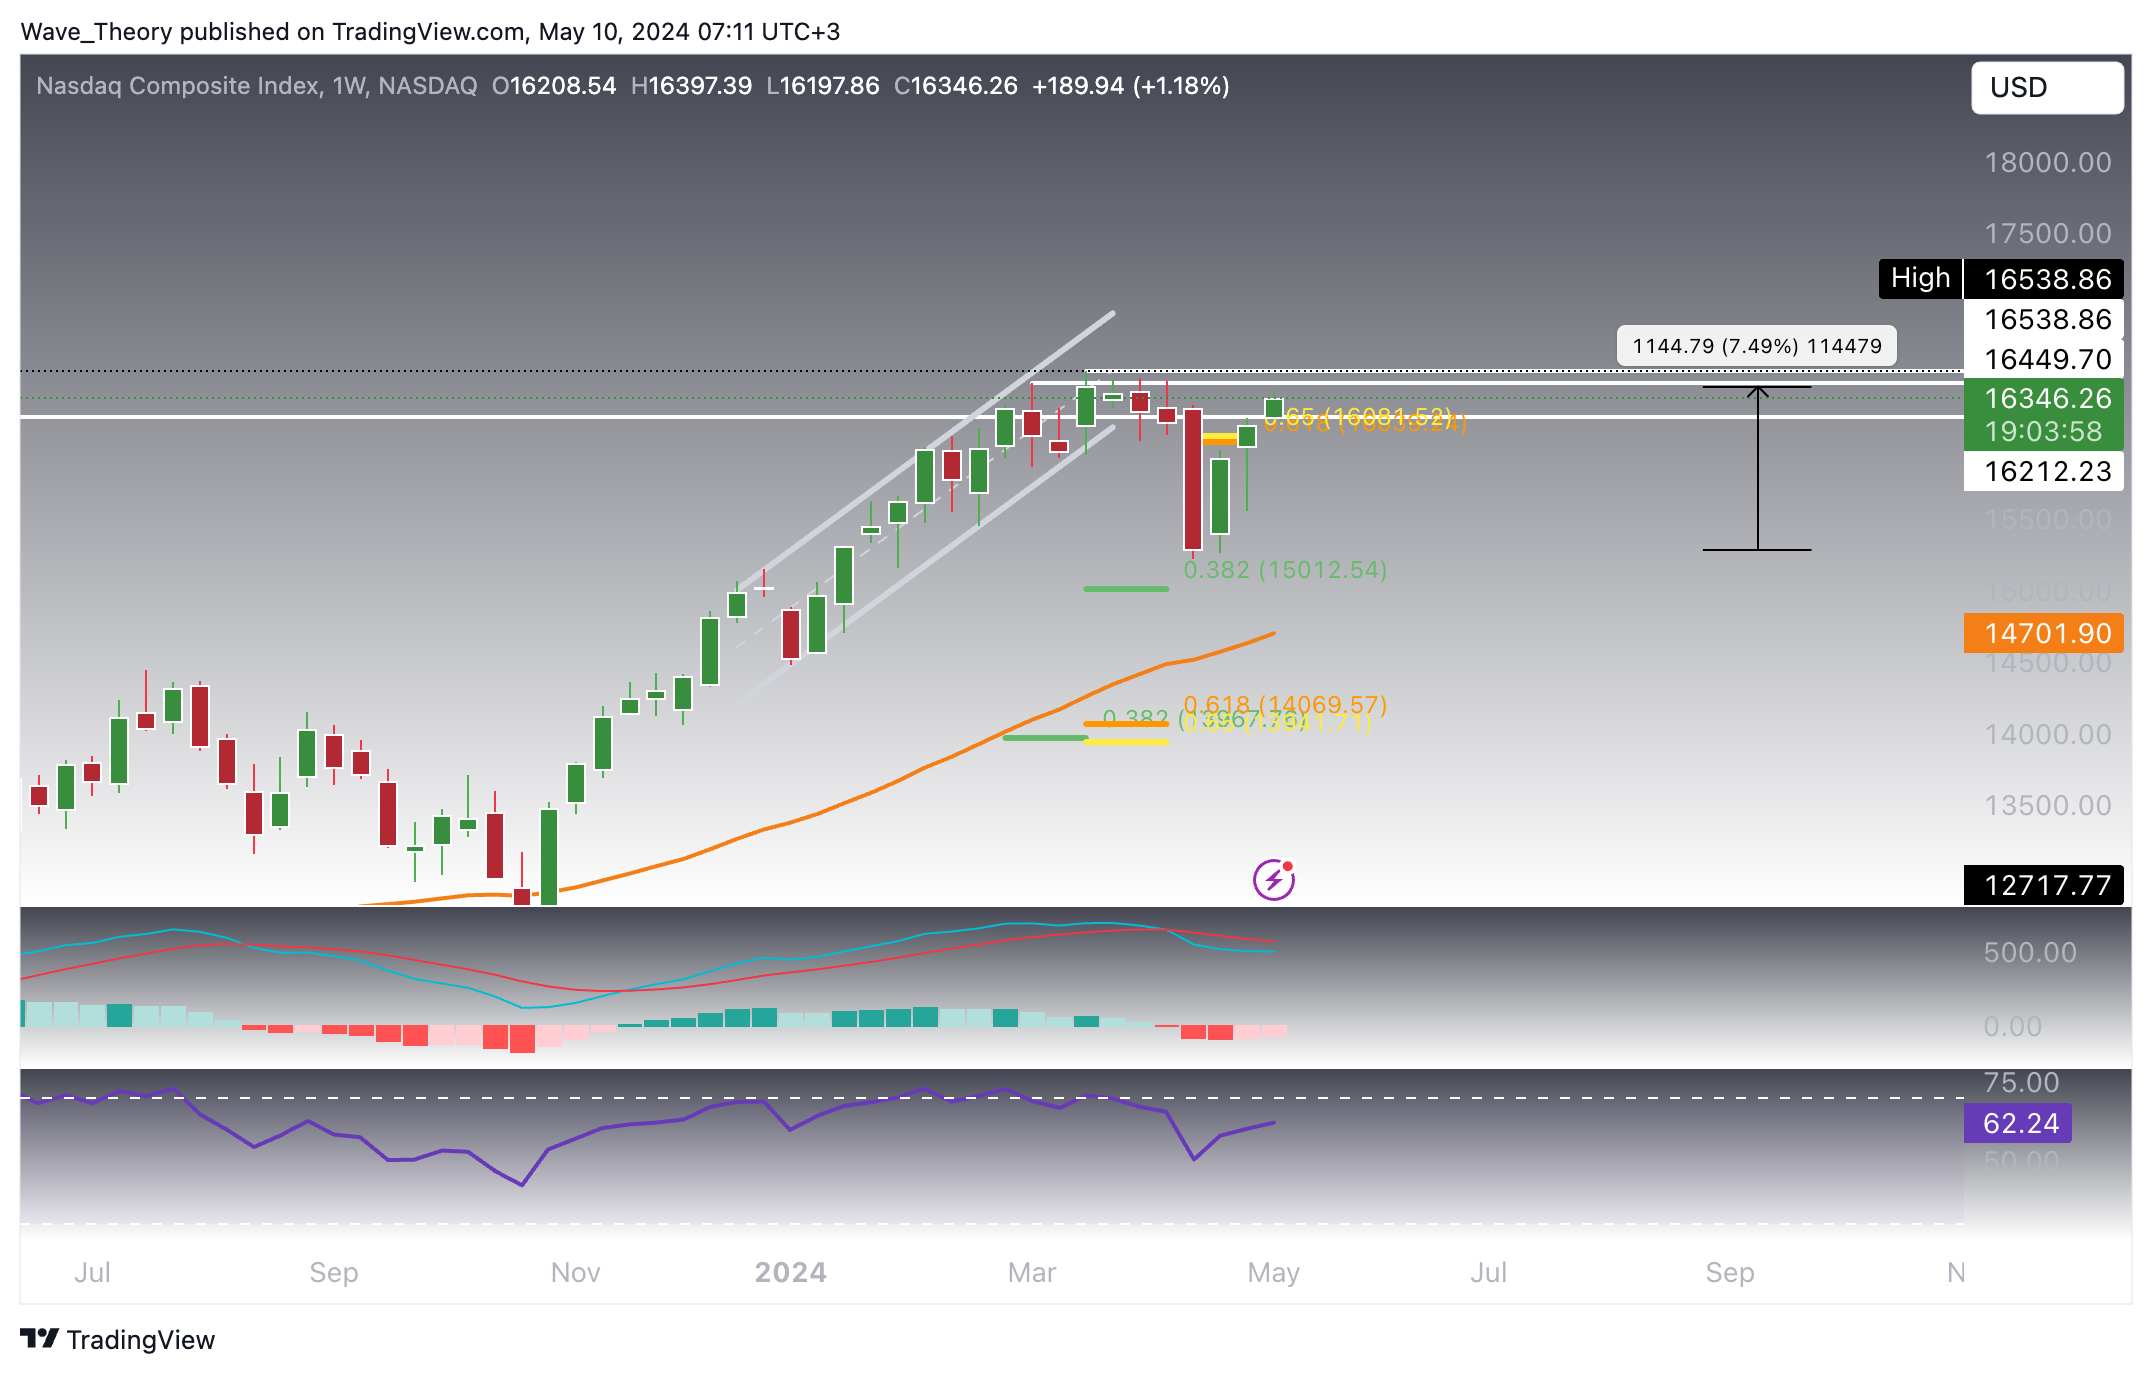
A bullish engulfing candle could form if the Nasdaq closes above 16,397 this month. The MACD histogram and lines are both trending bullish for the last two months, with the RSI in neutral territory.
If Naadaq faces rejection at the resistance between 16,450 and 16,538, it finds its next significant fib support levels at 15,013 and 14,000.
This analysis underscores a generally bullish outlook for these indices, supported by key technical indicators across multiple time frames, suggesting an inclination towards testing or exceeding previous all-time highs. However, traders should stay vigilant for any potential reversal signals at crucial resistance levels.
| Broker | Website | |
|---|---|---|
| 🥇 |  | Visit Broker >> |
| 🥈 |  | Visit Broker >> |
| 🥉 |  | Visit Broker >> |
| 4 |  | Visit Broker >> |
| 5 |  | Visit Broker >> |
| 6 |  | Visit Broker >> |
| 7 |  | Visit Broker >> |


