Forex Signals Brief May 15: Attention on US CPI and Retail Sales
Yesterday there was volatility after the US PPI, which shows market are agitated, so today we should se large moves after the CPI report

Yesterday we had the UK employment report which was pretty solid, despite the Unemployment Rate ticking higher to 4.3% in March from 4.2% in February. However, the average earnings index grew by 5.7%, beating expectations of a slowdown to 5.3%, while the Claimant Count Change despite turning positive this time, it came below expectations.

In the US session, the release of the PPI producer inflation report, occurring just a day before the CPI consumer producer report, presented an unusual situation as it offered a secondary measure of inflation. Both reports come from the Bureau of Labor Statistics (BLS), providing insights into seasonal adjustments and the potential direction of the crucial inflation report.
Initially, the US dollar experienced a surge when the headline PPI figure came in at +0.5%, exceeding the expected +0.2%. However, this move was short-lived as the previous month’s figure was revised downward to -0.1% from +0.2%, keeping the year-over-year reading unchanged at 2.2%. Consequently, the market reaction was relatively muted, and the initial gains were swiftly erased, showcasing the overall market’s inclination towards a buy-the-dips mindset. Fed Chair Powell further reinforced this sentiment with his usual dovish tone, characterizing the PPI report as ‘mixed not hot,’ particularly emphasizing the impact of the revisions. This interpretation further contributed to the fading of the initial market moves.
Today’s Market Expectations
Today it kicked off with the Wage Price index from Australia which was released early in the morning.
The Eurozone flash GDP report for Q1 will be released shortly, with expectations for the first quarter being unchanged from the Q4 of last year, at 0l..3% expansion. Flash Employment Change QoQ is also expected to be at 0.3%m while the Eurozoone industrial production is expected to grow by 0.5%, down from 0.8% in the previous quarter
The US CPI Inflation is the highlight of the week. The forecast would lower the year-on-year change in the core CPI by two tenths to 3.6%. In February, the headline CPI is predicted to grow by 0.4% month on month (previously by 0.3%), while the core rate of inflation is expected to climb by 0.3% month on month (previously by 0.4%). Following January’s pick-up in CPI, traders increased their hawkish bets on the projected path for policy rates, and they will look to February data to assist revise views of when the Fed will cut rates. Currently, the market has discounted the possibility of three rate cuts this year and assigns a reasonable chance of a fourth. Policymakers have been examining through a single month’s data and are focused on recent trend rates; in January, the rate of 3-month annualised core CPI jumped to 3.9% (from 3.3%), Meanwhile, the 6-month annualised rate increased to 3.5% (from 3.2%). Fed Chair Powell told lawmakers this week that while inflation remains around 2%, it has recently slowed somewhat. However, Powell emphasised that it would not be prudent to lower the policy rate until policymakers had greater confidence that inflation was heading stably towards 2%.
Besides the US CPI inflation, we also have the retail sales numbers for April. Sales MoM are expected to slow to 0.4% from 0.7% in the previous month, while Retail Sales YoY are expected to show an even larger slowdown, from 1.1% previously to 0.1% this time.
Yesterday there was a jump in the USD after the PPI report, but the move reversed and the USD ended lower, however the moves were not large, so the range was small once again. As a result, we only had three closed trades, with two winning forex signals and a losing signal in Dow Jones.
Gold Finds Any Reason to Rally
Gold continues to make higher lows, despite the volatility in recent weeks, experiencing significant price swings. After reaching highs around $2,400 in April, the price retraced below $2,300, finding support below the $2,300 level. Throughout this period, Gold traded within a range of $2,310 to $2,350, finding support at the 200 SMA (purple) on the H4 chart. However, in the past week, there has been renewed buying interest in Gold, propelling the price above both the 100-day Simple Moving Average (green) which has now turned into support.
XAU/USD – Daily chart
AUD/USD Trading Between 2 MAs
The USD/AUD has been oscillating within a narrow one-cent range for the past two weeks, confined between two key daily moving averages. Despite the release of the Wage Price Index last night, which failed to break the established range, the currency pair remained within its boundaries. This exchange rate experienced a reversal in April, following a steep decline of approximately 3 cents. This turnaround coincided with a series of negative developments for the US dollar. As the exchange rate climbed, it surpassed most of the daily chart’s moving averages, which have now transitioned into support levels. However, the 200-day Simple Moving Average (SMA) continues to act as resistance, constraining the price within a limited range. Additionally, improved risk sentiment has bolstered the strength of the Australian Dollar, contributing to the pair’s upward movement and propelling AUD/USD above the 200-day SMA.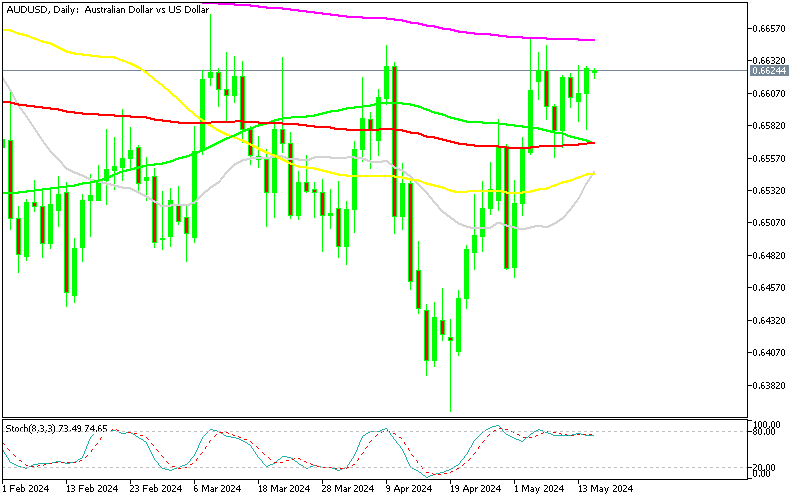
AUD/USD – H4 Chart
Cryptocurrency Update
Bitcoin Continues to Return Lower
Bitcoin has been exhibiting a pattern of lower highs since March, suggesting a potential shift towards a downturn or consolidation phase. Yesterday, the price of Bitcoin dropped to approximately $61,000 once again after the previous dip, which presented a buying opportunity for us. Technical indicators such as the 50-day and 20-day Simple Moving Averages (SMAs) are acting as resistance levels for Bitcoin, constraining its upward movement. However, Bitcoin found support near the 100-day Simple Moving Average (SMA) (green line) which continues to hold.
BTC/USD – Daily chart
Ethereum Remains Below $3,000
Ethereum (ETH) has exhibited notable volatility, experiencing fluctuations that led its price to dip below the $3,000 threshold multiple times. On the daily chart, Ethereum has even traded below its Simple Moving Averages (SMA). However, despite these fluctuations, Ethereum has demonstrated resilience, often bouncing back and surpassing the $3,000 level. This resilience underscores the significant support that exists below the $3,000 mark, but the bounces are getting weaker every time, suggesting that the buying interest might be running out.
ETH/USD – Daily chart
- Check out our free forex signals
- Follow the top economic events on FX Leaders economic calendar
- Trade better, discover more Forex Trading Strategies
- Open a FREE Trading Account
- Read our latest reviews on: Avatrade, Exness, HFM and XM
Related Articles


Sidebar rates
Related Posts
