GameStop Stock (GME): Primed for a Second Surge?

Based on the recent technical analysis, the GameStop stock (GME) poised for a second bull-run, potentially reaching a new all-time high.
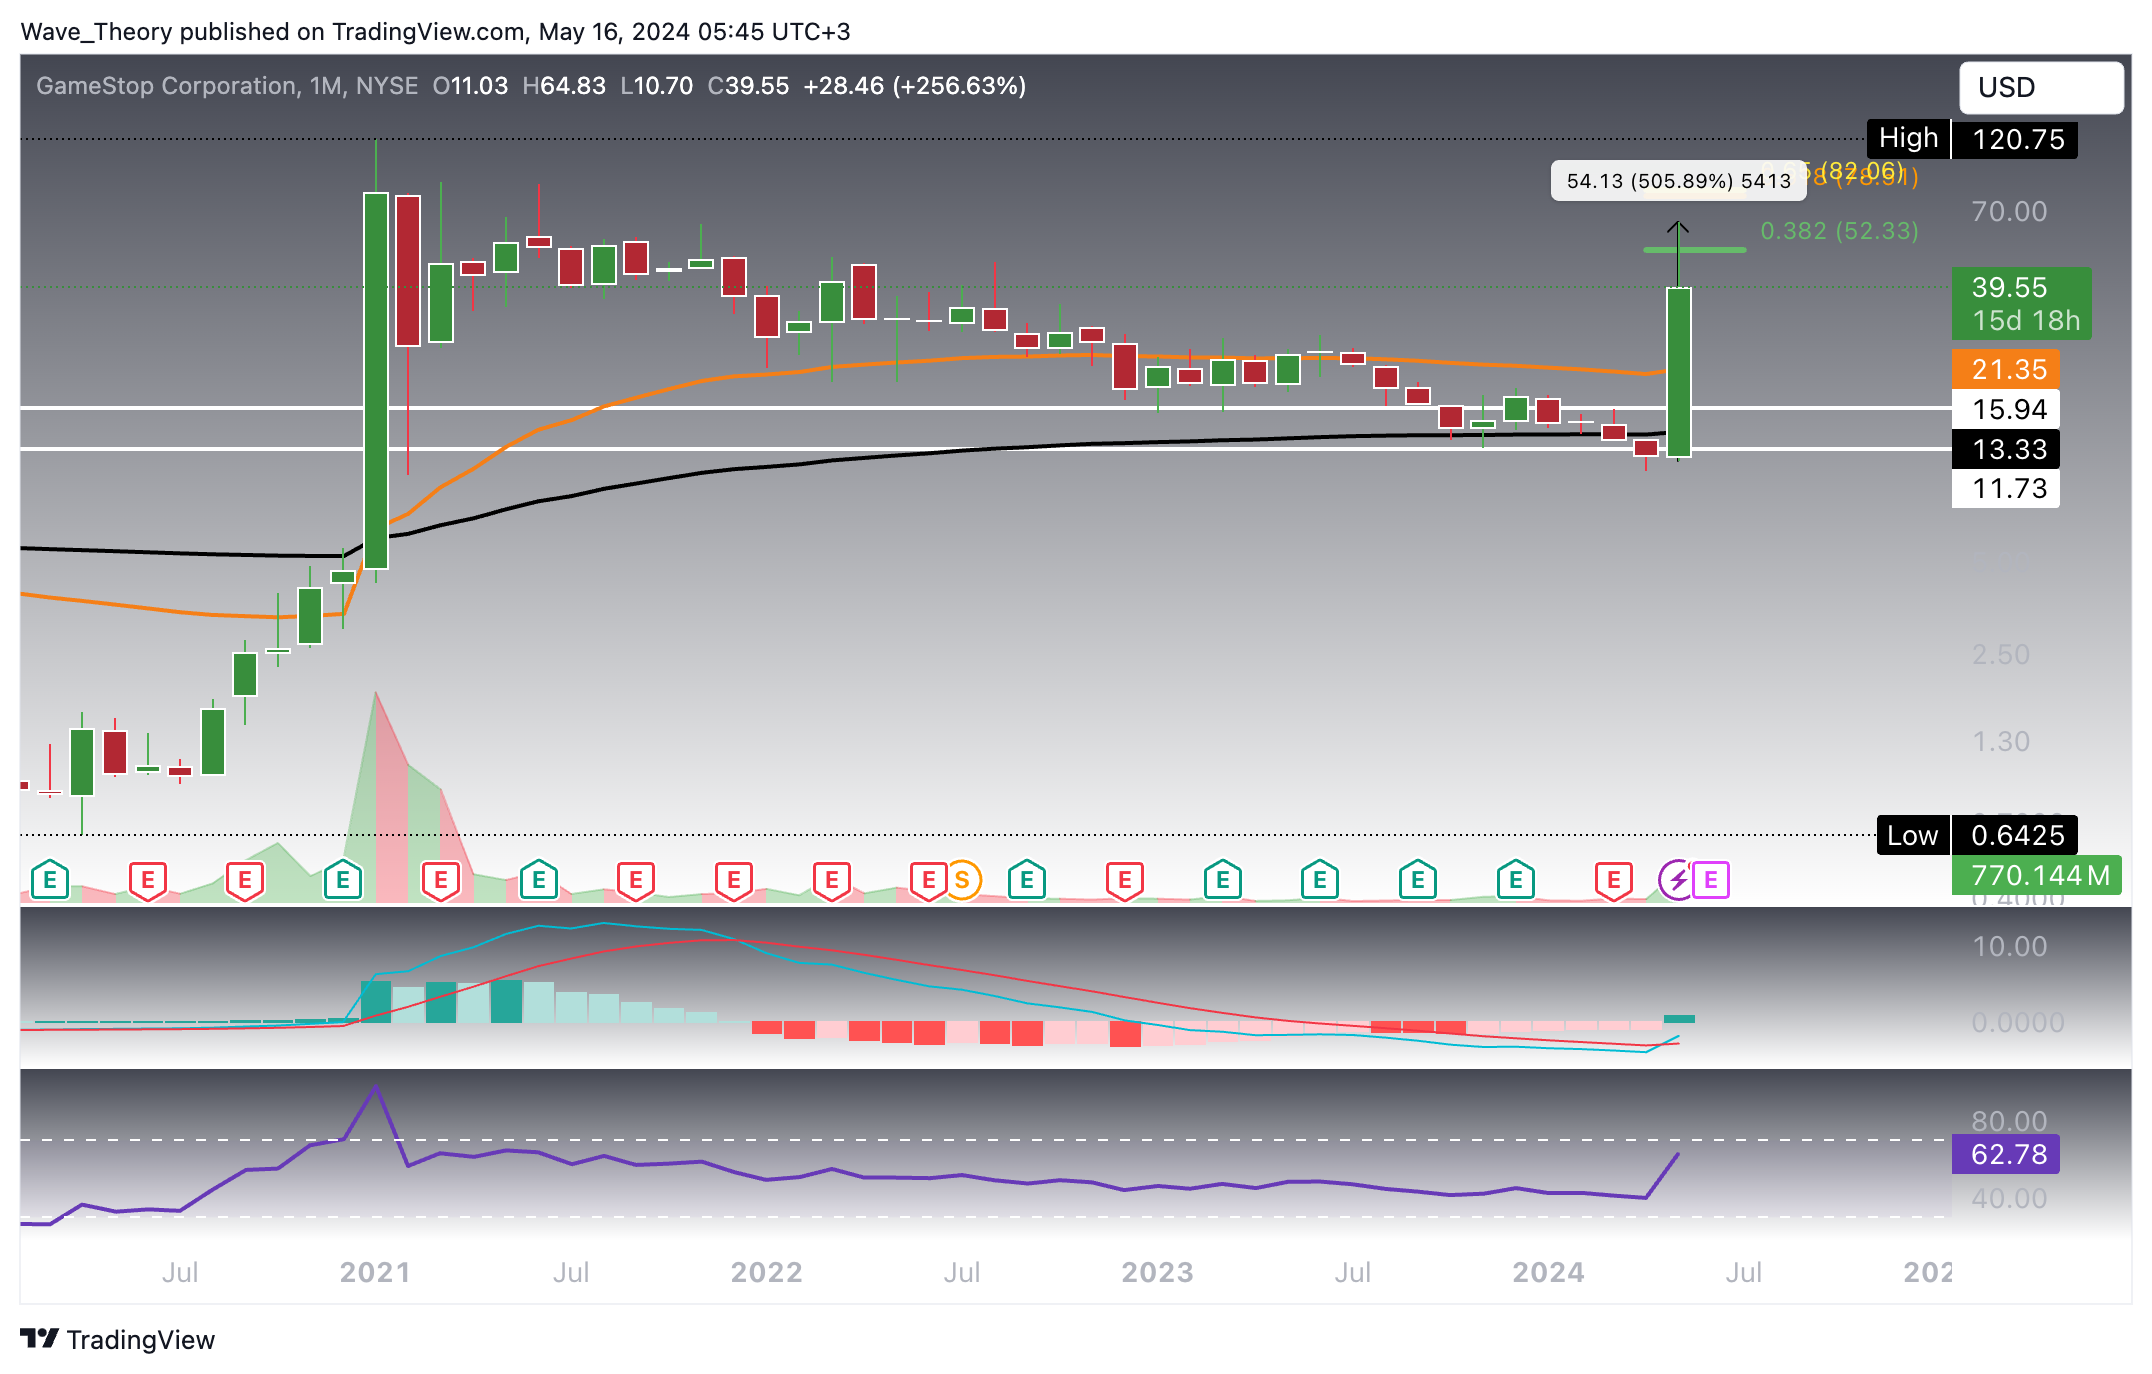
GameStop stock (GME) Surged By Over 505 % This Month
Following a prolonged correction lasting over three years, GameStop stock (GME) rebounded from a support zone between $11.73 and $15.94, surging nearly 506%. This impressive rally broke through the 50-month EMA resistance at $21.35, propelling the stock towards the major Fibonacci resistance at $52.33. At this level, GME may face rejection and enter a corrective phase. However, should it surpass this barrier, the next significant resistance lies at the golden ratio of $82. Breaking the $82 level would suggest a new bull run, potentially pushing GME past its previous all-time high of $120.
Moreover, the MACD lines have crossed bullishly, with the MACD histogram indicating a bullish trend. Meanwhile, the RSI is approaching overbought territory without any bearish signals.
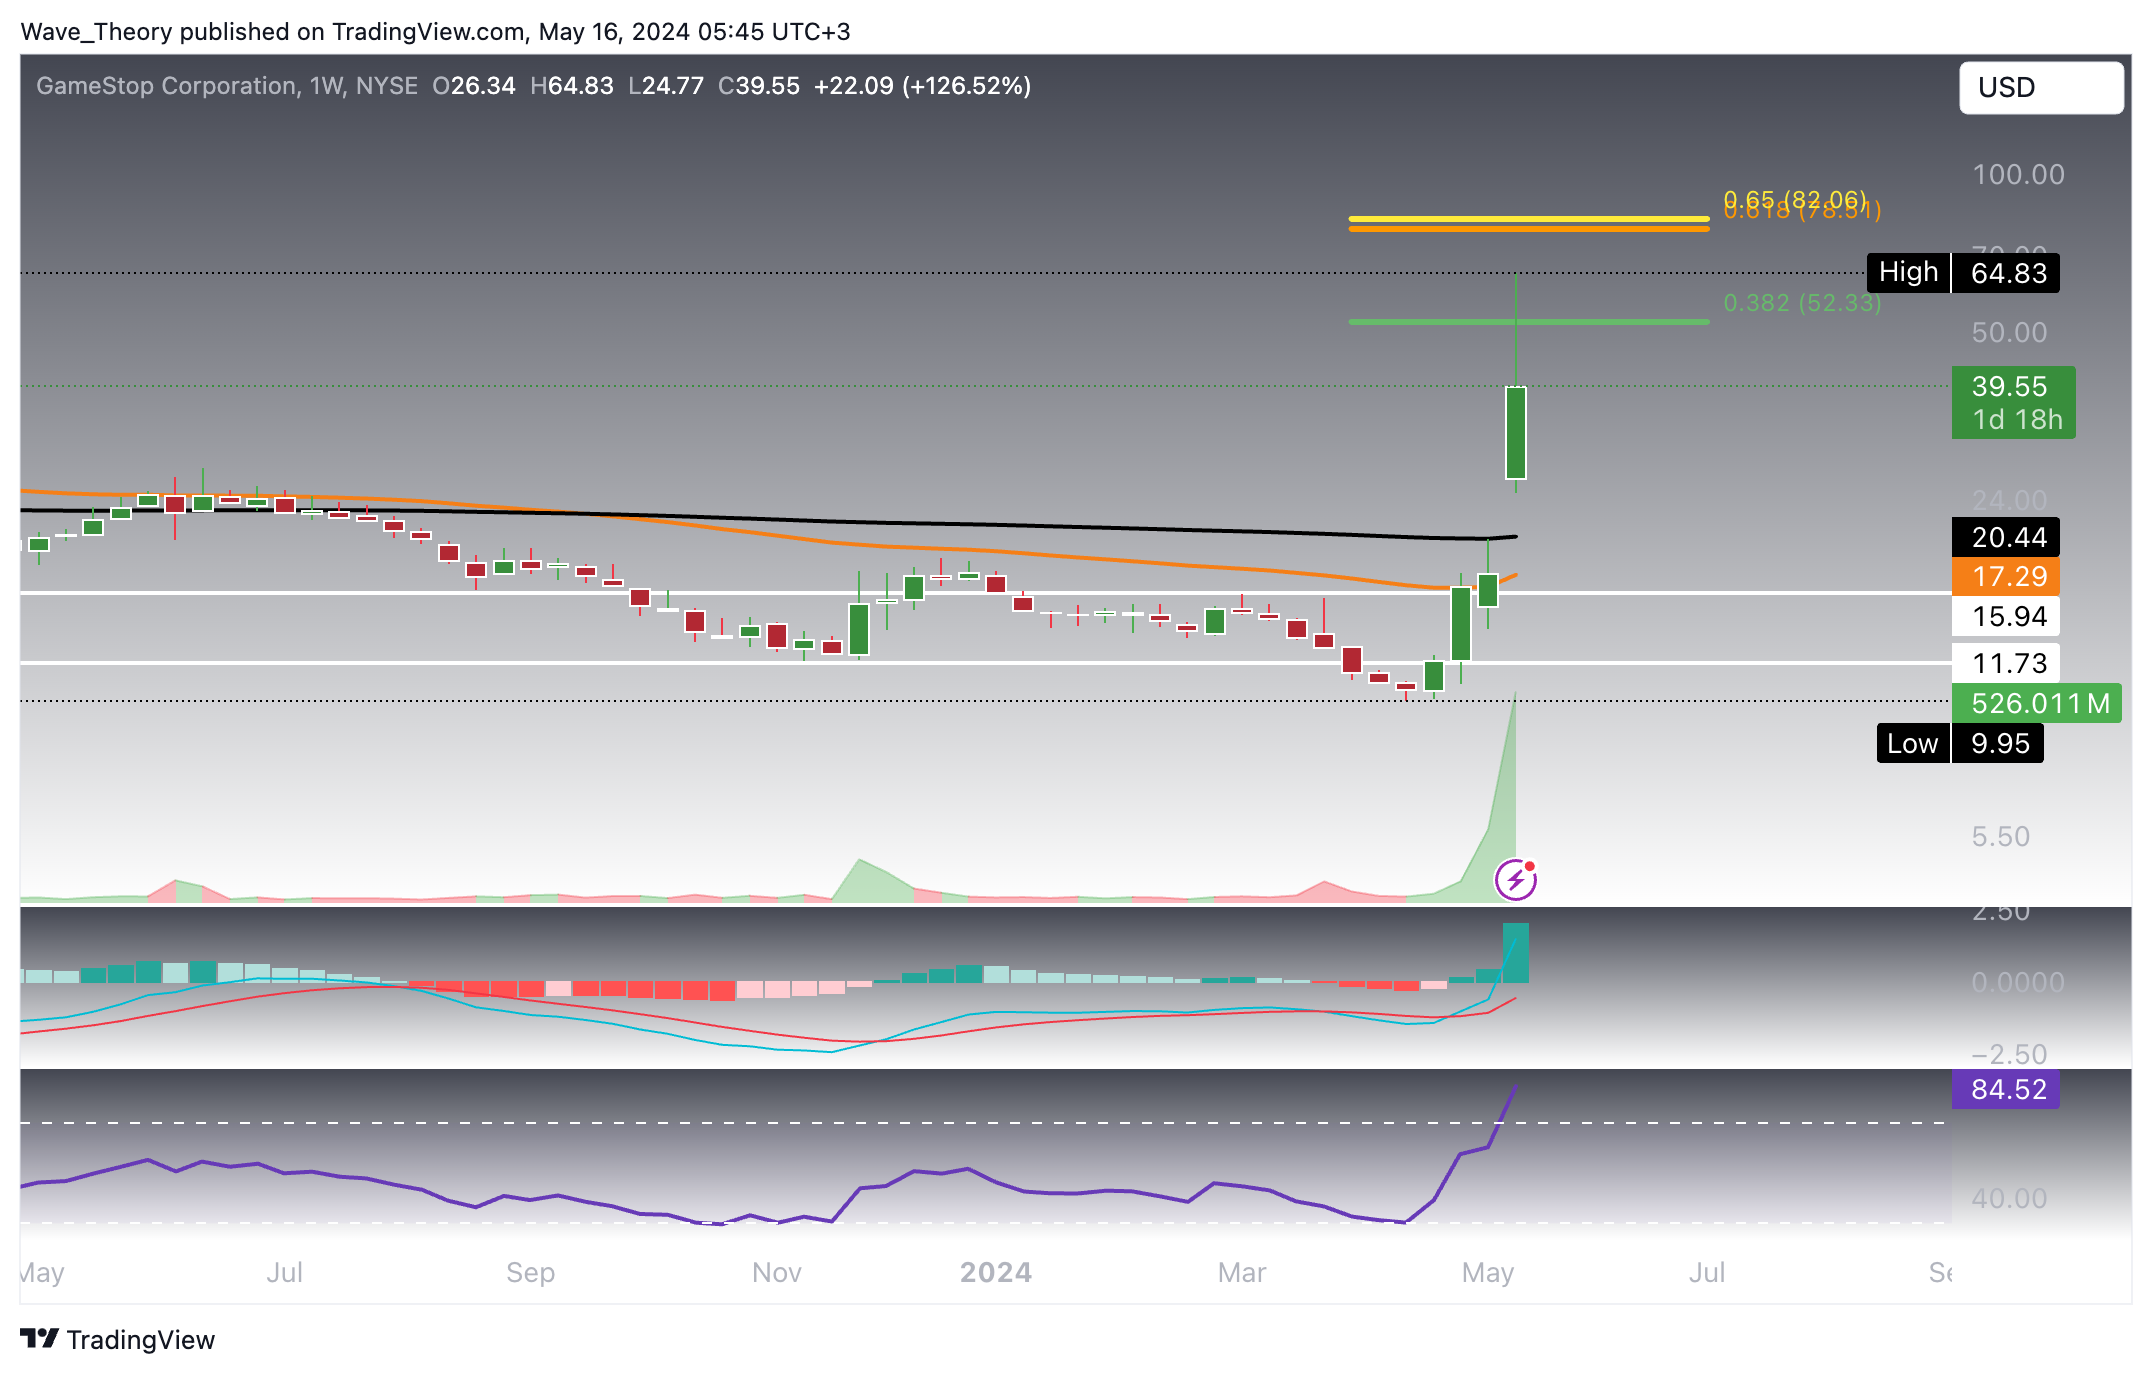
Weekly Indicators Show Bullish Momentum
In the weekly chart, the MACD histogram has started ticking upwards, with the MACD lines crossing bullishly. Although the RSI has entered overbought regions, it has yet to show signs of bearish divergence. Contrarily, the EMAs still display a death cross, indicating a bearish trend in the mid-term.
Golden Crossover Imminent on the Daily Chart
On the daily chart, the RSI is firmly in overbought territory without bearish divergence. Additionally, the MACD histogram is moving higher bullishly, and the MACD lines are crossed in a bullish manner. Furthermore, the EMAs are on the verge of forming a golden crossover, signaling a bullish trend in the short to medium term. Currently, GME has retraced to the golden ratio support at $30, where it bounced and surged by approximately 36%.

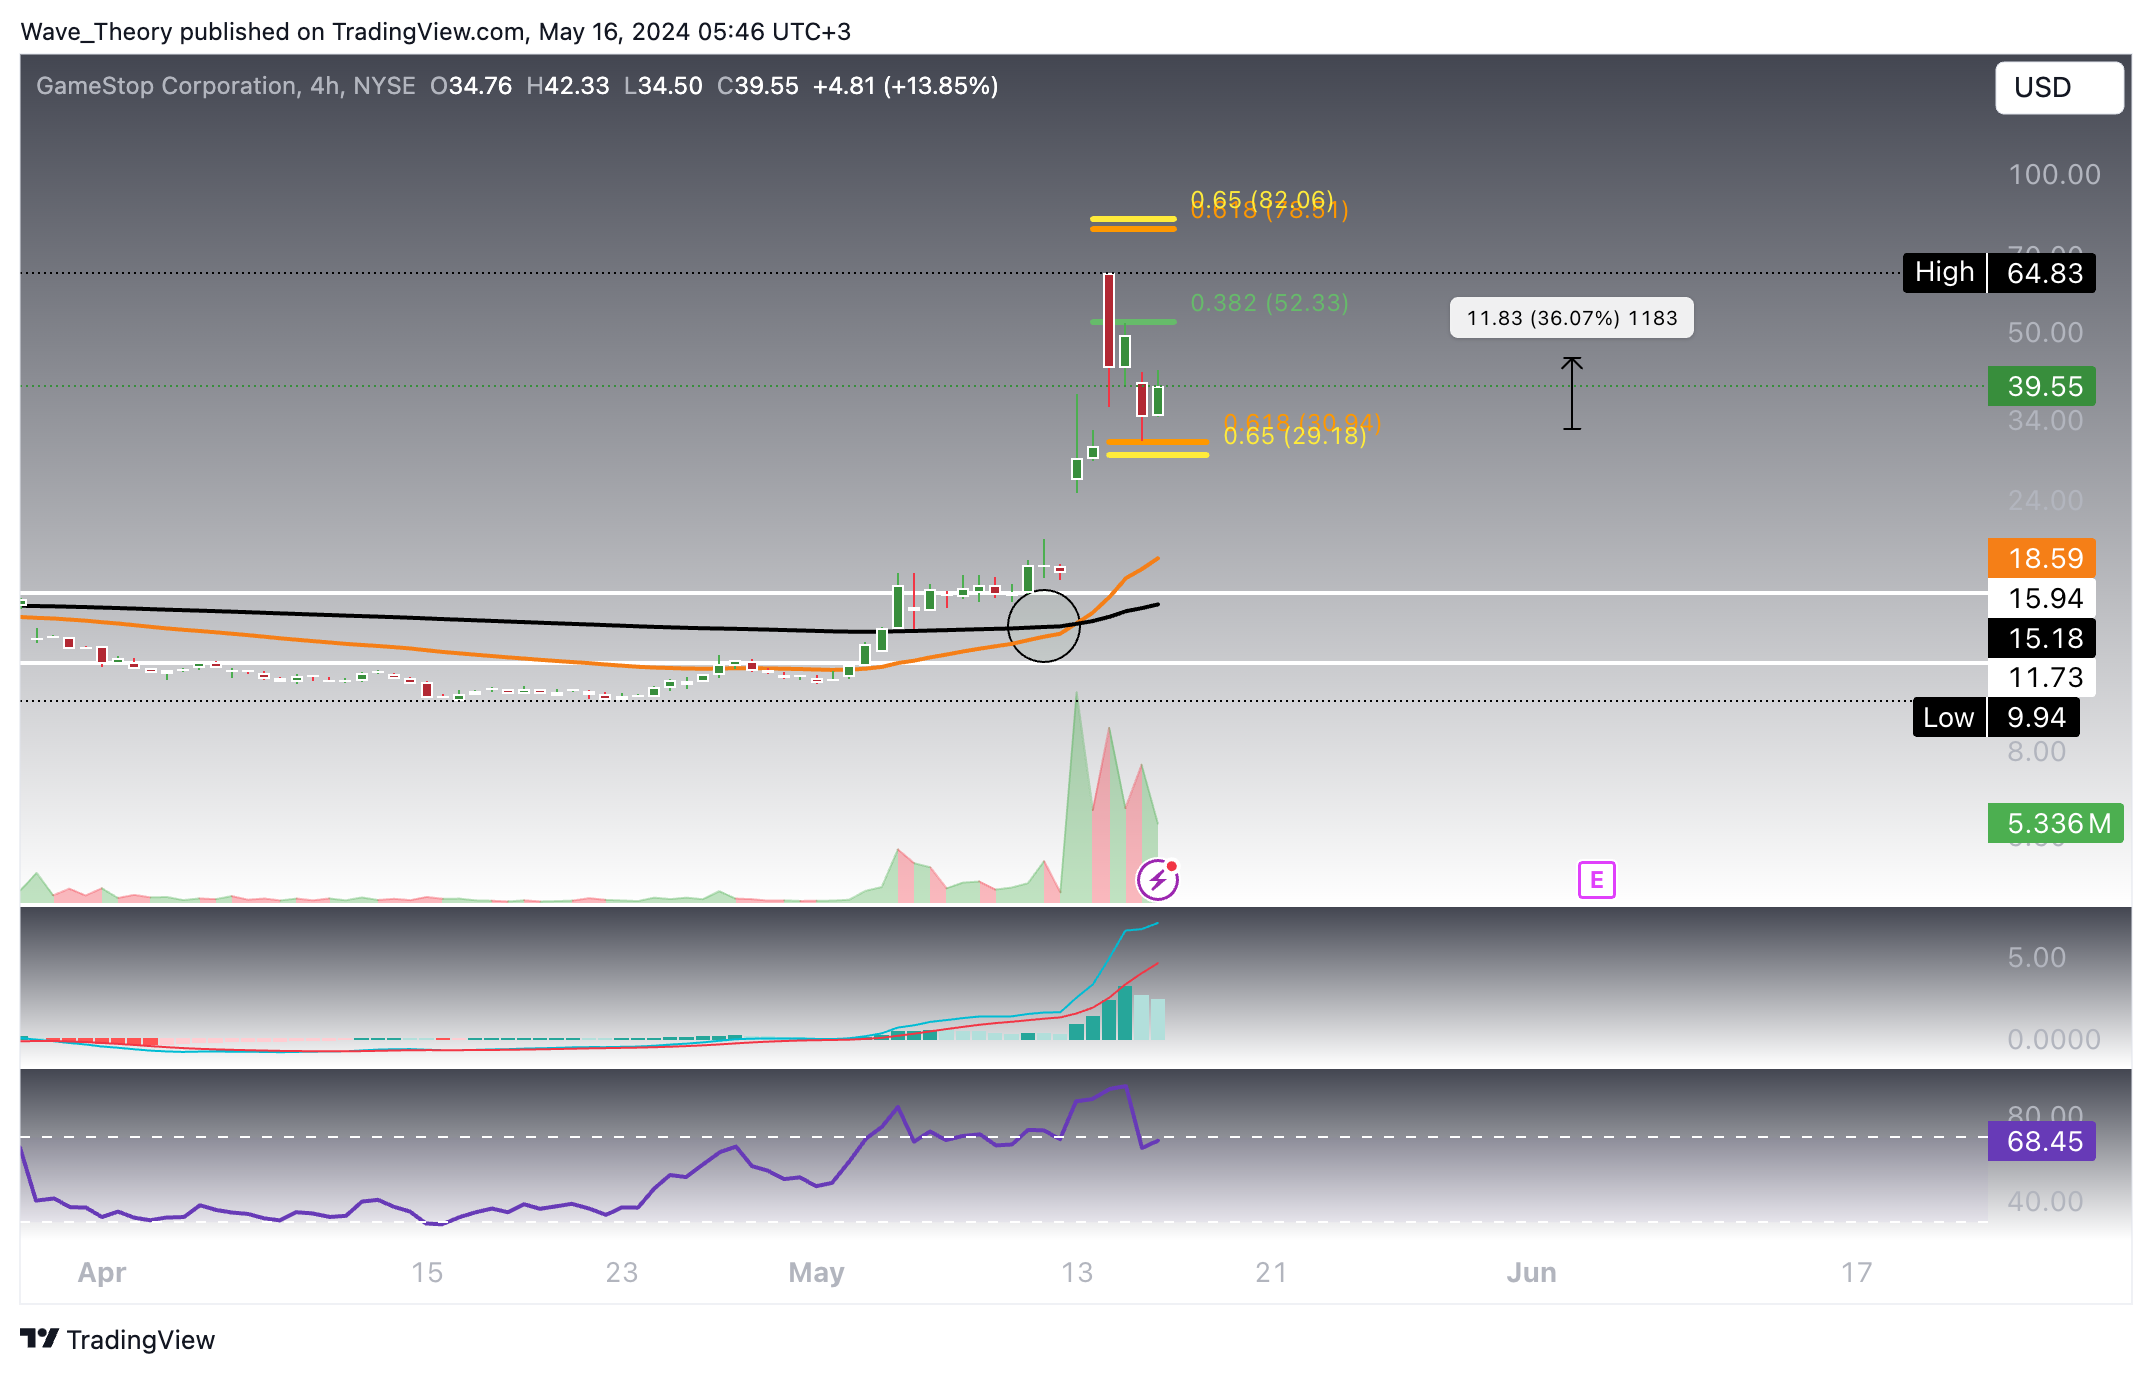
GME Bounces Off Golden Ratio Support by 36%
In the 4-hour chart, the EMAs have already formed a golden crossover, confirming a short-term bullish trend. The MACD lines are crossed bullishly, although the MACD histogram is starting to tick lower. The RSI provides no clear signals but remains near overbought regions. Presently, GME appears poised for another upward wave towards the 0.382 Fibonacci resistance at $52.33.
- Check out our free forex signals
- Follow the top economic events on FX Leaders economic calendar
- Trade better, discover more Forex Trading Strategies
- Open a FREE Trading Account
- Read our latest reviews on: Avatrade, Exness, HFM and XM
Related Articles


Sidebar rates
Related Posts
