Forex Signals Brief May 29: Australian and German Inflation
Today the CPI inflation reports from Australia and Germany will highlight the day
Yesterday started with the retail sales from Australia and the core CPI inflation from Japan, both of which missed expectations. However, both the JPY and the AUD made gains against the USD during the Asian and European sessions, with the USD in retreat after the US session, when we saw a comeback after economic events in the US.

In the US session, the consumer confidence index significantly exceeded forecasts, rising to 102.00 points compared to the expected 95.9 points. This marked a notable improvement from last month’s revised 97.5 points. The stronger consumer confidence underscores the robust sentiment among consumers, likely fueled by a strong labor market and resilient economic conditions. In other financial news, the US Treasury auctioned a record amount of two-year and five-year notes.
However, the demand for both was below average, as indicated by positive tails of 1.0 and 1.3 basis points, respectively. The bid-to-cover ratios, which reflect the demand for the notes relative to the amount offered, were low and consistent with six-month averages. This tepid demand suggests investor caution, possibly due to concerns about future rate hikes or inflationary pressures. As a result of these auctions, yields increased today.
The two-year yield, approaching the 5% mark, is currently trading at 4.980%, up 2.8 basis points. The 10-year yield saw a significant rise, trading at 4.551%, up 7.9 basis points on the day. The increase in yields reflects the market’s reaction to the weak auction demand and the strong consumer confidence data, which together suggest a less dovish outlook for future Federal Reserve policy actions.
Today’s Market Expectations
Today it started with the CPI inflation for April from Australia. The Australian Consumer Price Index (CPI) data for April exceeded expectations, coming in at 3.6% year-over-year (y/y), above the consensus estimate of 3.4% and higher than the prior reading of 3.5%. The month-over-month (m/m) CPI increased by 0.76%. Additionally, the trimmed mean CPI, which excludes volatile items, rose to 4.1% y/y, up from the previous 4.0%. The CPI excluding volatile items and holiday travel remained steady at 4.1% y/y.
The Economic Club of New York will host a speech by Fed’s Christopher Waller on the “Economic Outlook.” Waller is a significant member of the Federal Open Market Committee (FOMC) and has historically been a “leading indicator” for changes in Fed policy. In December 2021, he was the first to discuss Quantitative Tightening (QT), and in November 2023, he was the first to bring up rate cuts. Given the recent hot CPI numbers and the FOMC’s latest decision, his speech will be closely watched for hawkish signals. Given Waller’s track record, his insights could provide important clues about the future direction of monetary policy. If he continues his hawkish stance, it may indicate that the Fed is inclined to maintain or even increase interest rates to combat persistent inflation. This would align with the recent CPI data that showed higher-than-expected inflation, suggesting that the Fed might need to take more aggressive measures to control price increases.
Yesterday we had some nice price action in financial markets, with the USD making a comeback after the decline on Monday. We had many closed trading signals, as volatility remained high until the end of the US session and closed a good day, with 5 winning forex signals and two losing ones.
The Bounce Off the 20 SMA Continues for Gold
Last week, gold (XAU/USD) surged to a new record high of $2,450, but it retreated in the second half of the week, reaching lows of $2,325. On Friday, the 100-day Simple Moving Average (SMA) provided support, and XAU/USD rose to $2,350 yesterday—a 1.50% increase from the previous week’s low. This rebound suggests that the rise in gold and other commodity prices is not solely driven by geopolitical concerns but is part of a broader upward trend in the commodities market. The recovery in gold, along with gains in silver and copper, indicates a bullish trend in the metals market overall. Investors appear to be turning to these assets in response to current global uncertainties, reinforcing their status as safe havens. The support from the 20-day SMA highlights technical strength in gold, and the concurrent rise in other metals like silver and copper points to a broader confidence in the commodities sector. This trend is being observed amidst a backdrop of rising geopolitical tensions and economic concerns, which are prompting investors to seek stability in tangible assets. The consistent performance of these metals underlines their value as protective investments during times of volatility and uncertainty.
XAU/USD – Daily chart
The Bullish trend Might be Over for GBP/USD
Over the last two months, the GBP/USD has shown a strong trend; however, the bullish momentum may be ending. From the lower end of its two-year trading range between 1.20 and 1.30, this pair recovered. The current price behaviour, nevertheless, indicates that this upward impetus might be waning. The behaviour of the 100 Simple Moving Average (SMA), shown as the red line on the chart, is one important sign of this possible reversal. Since rejecting it earlier in March, the 100-day smooth MA has been a crucial resistance indication for this currency pair this year. The price of GBP/USD is currently moving away from the 100-day SMA, suggesting that it is once again serving as resistance for the pair. .This implies that as the bullish mood wanes, we may witness a bearish reversal towards the bottom of the range, around the 100 simple weekly MA (yellow).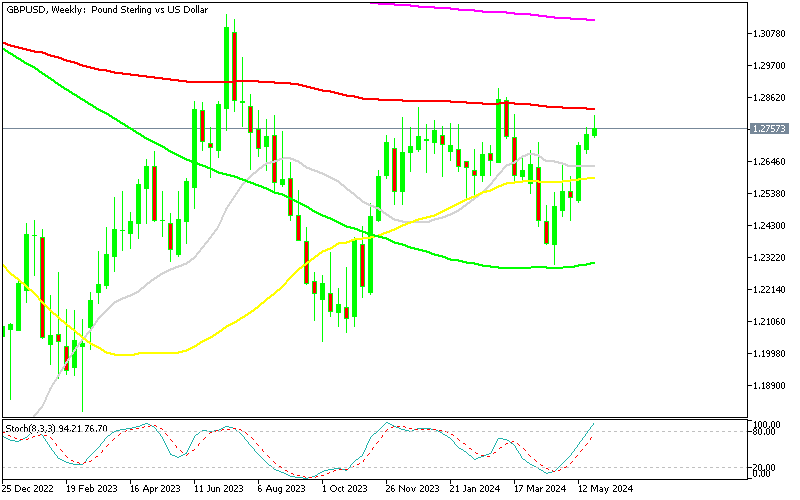
GBP/USD – Daily Chart
Cryptocurrency Update
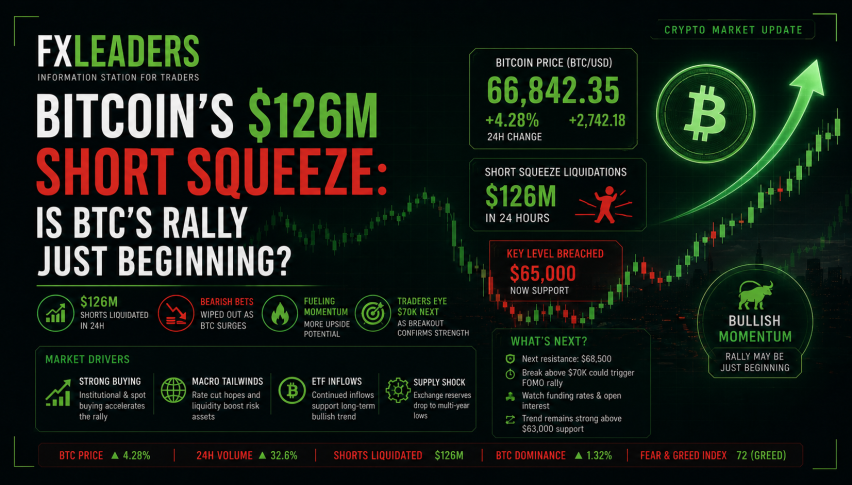
Bitcoin Can’t Hold Above $70K
The long-term trend for Bitcoin remains upward, supported by the 100-day Simple Moving Average (SMA), which currently acts as a strong support level. Historically, technical indicators such as the 20-day and 50-day SMAs have posed resistance to Bitcoin’s upward momentum. However, as indicated on the daily chart, Bitcoin has managed to surpass these resistance levels, suggesting that the 50-day SMA is likely to become a new support level. Despite the recent three-day slump, Bitcoin demonstrated its upward momentum by surpassing the $70,000 mark on Monday. This resilience implies that the market sentiment towards Bitcoin remains positive, even amidst temporary price declines. The correction in Bitcoin’s price may be perceived by traders and investors as a strategic entry point to capitalize on the long-term bullish trend.
BTC/USD – Daily chart
Ethereum Within Reach of $4,000
he heightened confidence stemming from the SEC’s more optimistic stance on spot Ether ETFs has led Ether (ETH) to surge to a fresh high of $3,832.50. This sharp increase from its previous peak of around $3,000 represents a remarkable 25% gain in Ethereum’s value. Given this substantial growth, we decided to capitalize on the positive momentum by closing our buy Ethereum signal at a profit yesterday. The approval of the Ethereum ETF is seen as a major milestone, potentially paving the way for increased institutional investment and broader acceptance of Ethereum. This approval is expected to provide more stability and liquidity to the market, further driving prices upward in the long term. The current bullish trend in Ethereum, supported by the ETF news, indicates strong market confidence and investor interest. This environment suggests that the positive momentum may continue, although traders should remain vigilant for potential market corrections. The broader cryptocurrency market could also benefit from this development, as increased institutional interest in Ethereum might spill over into other digital assets, contributing to overall market growth.
ETH/USD – H4 chart
- Check out our free forex signals
- Follow the top economic events on FX Leaders economic calendar
- Trade better, discover more Forex Trading Strategies
- Open a FREE Trading Account
- Read our latest reviews on: Avatrade, Exness, HFM and XM
Related Articles

Sidebar rates
Related Posts
