GBP/USD Eyes $1.3320 Breakout as U.K. Jobs Data Disappoints and CPI Boosts Dollar
GBP/USD is trading cautiously at $1.3306 in early Wednesday trading after yesterday’s UK labour market data...
Quick overview
- GBP/USD is trading cautiously at $1.3306 following UK labor market data that raised economic slowdown concerns.
- The UK claimant count change rose by 5.2K in April, and the unemployment rate increased to 4.5%, the highest since mid-2021.
- In the US, softer CPI data supports the dollar, while a trade truce with China boosts risk appetite.
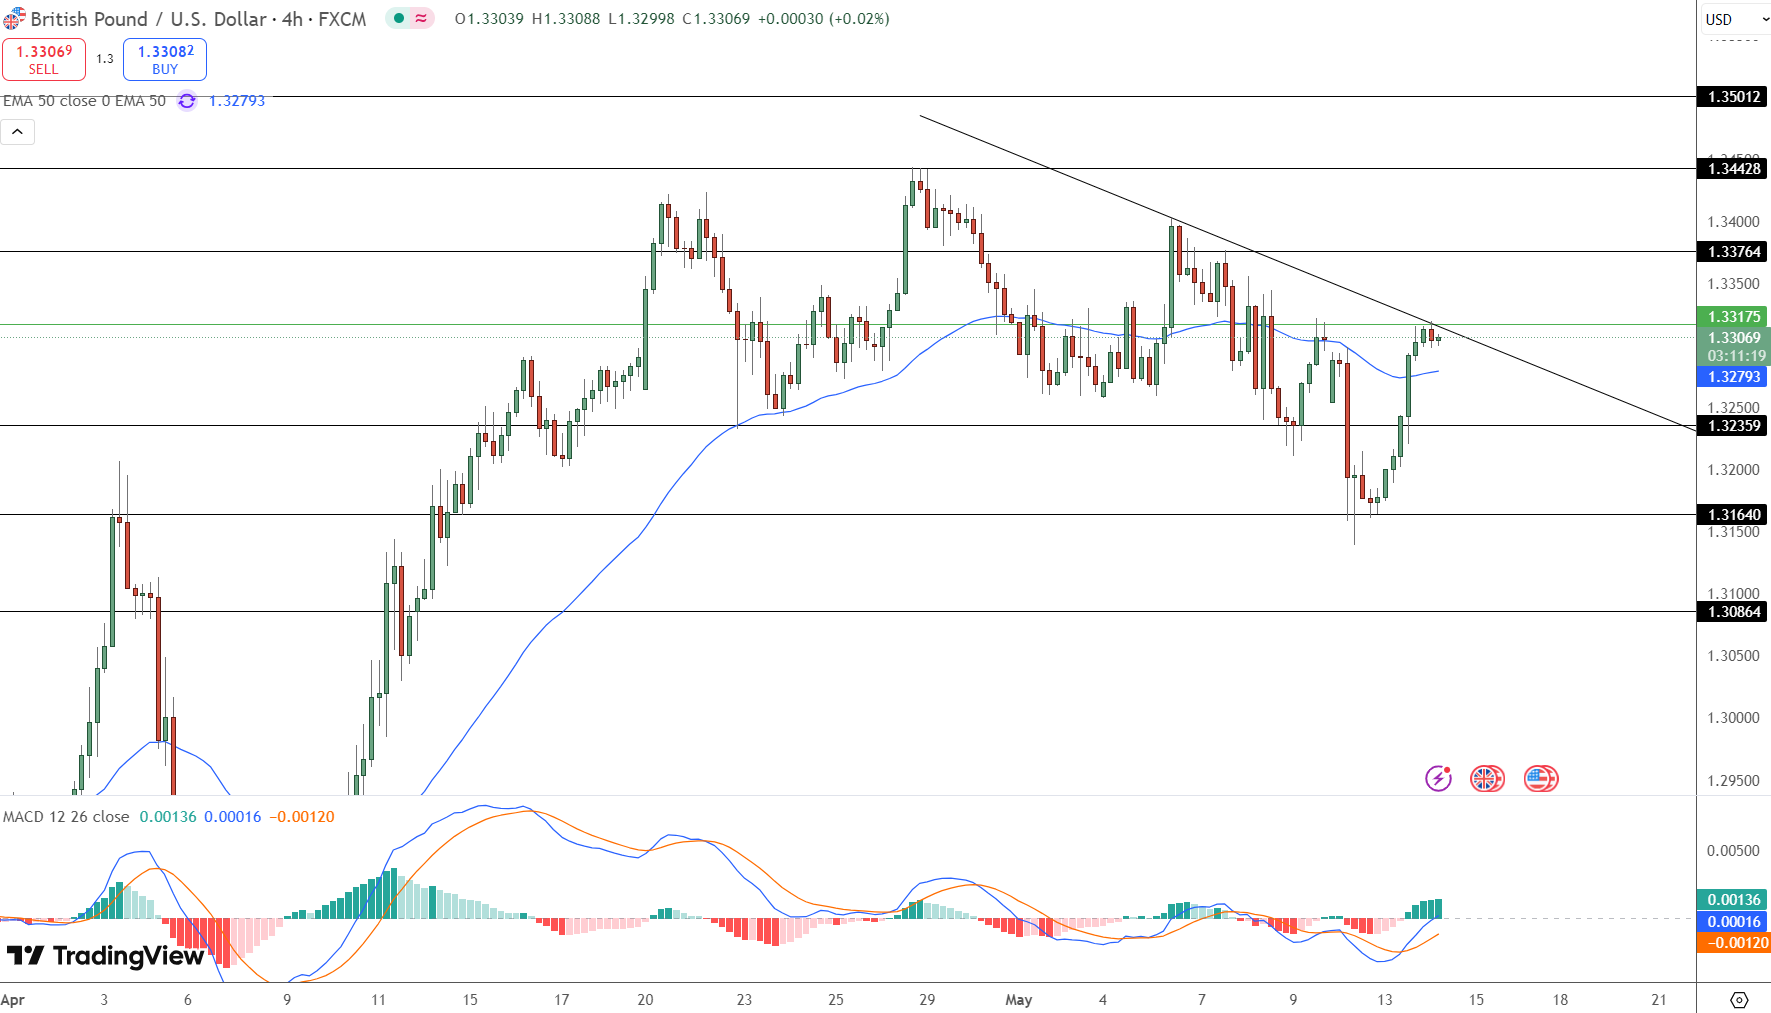
- GBP/USD is testing trendline resistance at $1.3317, with a potential bullish breakout if it surpasses this level.
GBP/USD is trading cautiously at $1.3306 in early Wednesday trading after yesterday’s UK labour market data added to the economic slowdown concerns. Claimant count change rose by 5.2K in April, well below the 22.3K previous and unemployment rate ticked up to 4.5%, the highest since mid 2021.
Average earnings including bonuses slowed to 5.5% from 5.7%, still high by historical standards. The data has led to speculation the BoE may cut again after cutting to 4.25% last week.
Comments from MPC members Pill and Bailey didn’t help calm markets, both reiterated a cautious stance with inflation and growth still weak. The CB Leading Index also fell -0.4%, more bad news for sterling.
US CPI steady, Dollar supported by trade truce
Across the pond, the US Dollar is holding strong as the latest CPI data came in softer than expected. Core CPI rose 0.2% in April (vs 0.3% expected), headline inflation 2.3% year over year. The softer inflation print supports the view the Fed may delay further rate hikes, but not pivot to cuts just yet.
Meanwhile the 90 day tariff truce between the US and China is still supporting risk appetite and dollar demand. The US will lower tariffs on Chinese imports from 145% to 30%, China will lower its tariffs from 125% to 10%, a temporary reprieve for global trade.
Technical: GBP/USD tests trendline
GBP/USD is testing the trendline resistance at $1.3317. A break above this level would shift momentum to $1.3376 and potentially the April high $1.3442. The pair is above its 50 period EMA ($1.3279) so bullish.
Indicators to Watch:
-
MACD: Bullish crossover confirmed, histogram positive
-
EMA 50: Price above dynamic support
-
Trendline Resistance: Break above $1.3317 would confirm continuation
GBP/USD Trade
-
Buy Entry: $1.3320+ (after confirmed breakout)
-
Target 1: $1.3376
-
Target 2: $1.3442
-
Stop Loss: Below $1.3270
Below $1.3317 and we may see consolidation, down to $1.3235 or $1.3164 if bearish.
- Check out our free forex signals
- Follow the top economic events on FX Leaders economic calendar
- Trade better, discover more Forex Trading Strategies
- Open a FREE Trading Account